
Overview
This strategy is a trend-following trading system that combines Bollinger Bands and Moving Average. It utilizes Bollinger Bands to capture price volatility breakouts while using Moving Average to confirm trend direction, forming a complete trading decision framework. The core concept requires price breakouts of Bollinger Bands to align with the Moving Average direction, creating a dual confirmation mechanism that effectively reduces false signals.
Strategy Principles
The strategy employs two core technical indicators:
- Bollinger Bands (BB): Composed of a middle band (20-period SMA) and upper/lower bands (middle band ±2 standard deviations), used to measure price volatility range.
- Moving Average (MA): Supports both Simple Moving Average (SMA) and Exponential Moving Average (EMA), used to confirm overall trend direction.
Trading signal generation logic:
- Long conditions: Price breaks above lower band and is above Moving Average
- Short conditions: Price breaks below upper band and is below Moving Average
- Exit conditions: Price crosses Moving Average or deviates from MA direction
Strategy Advantages
- Dual confirmation mechanism: Combining Bollinger Band breakouts and MA trend confirmation significantly improves signal reliability
- Strong adaptability: Bollinger Bands automatically adjust bandwidth based on market volatility
- High customizability: Supports adjustments to BB period and multiplier, and different MA types
- Robust risk control: Uses Moving Average as dynamic stop-loss, helping control drawdowns
Strategy Risks
- Choppy market risk: May generate frequent false breakout signals during consolidation phases
- Lag risk: Moving Average has inherent lag, potentially causing delayed entries or exits
- Trend reversal risk: Strategy may not respond quickly enough to sudden trend reversals
- Parameter sensitivity: Optimal parameters may vary significantly across different market environments
Optimization Directions
- Introduce trend strength filtering: Add indicators like ADX to increase positions in strong trends and reduce trading in weak trends
- Optimize stop-loss mechanism: Incorporate ATR for dynamic stop-loss levels, improving risk control flexibility
- Enhanced market environment analysis: Include volatility indicators like VIX for dynamic parameter adjustment
- Improve position management: Dynamically adjust position sizes based on volatility and trend strength
Summary
This is an innovative trend-following strategy combining classic technical indicators Bollinger Bands and Moving Average. It captures price breakout opportunities through Bollinger Bands while confirming trend direction with Moving Average, forming a logically rigorous trading system. The strategy demonstrates strong adaptability and customizability, but requires careful attention to market environment assessment and risk control in practical application. Through the suggested optimization directions, there is significant room for strategy enhancement.
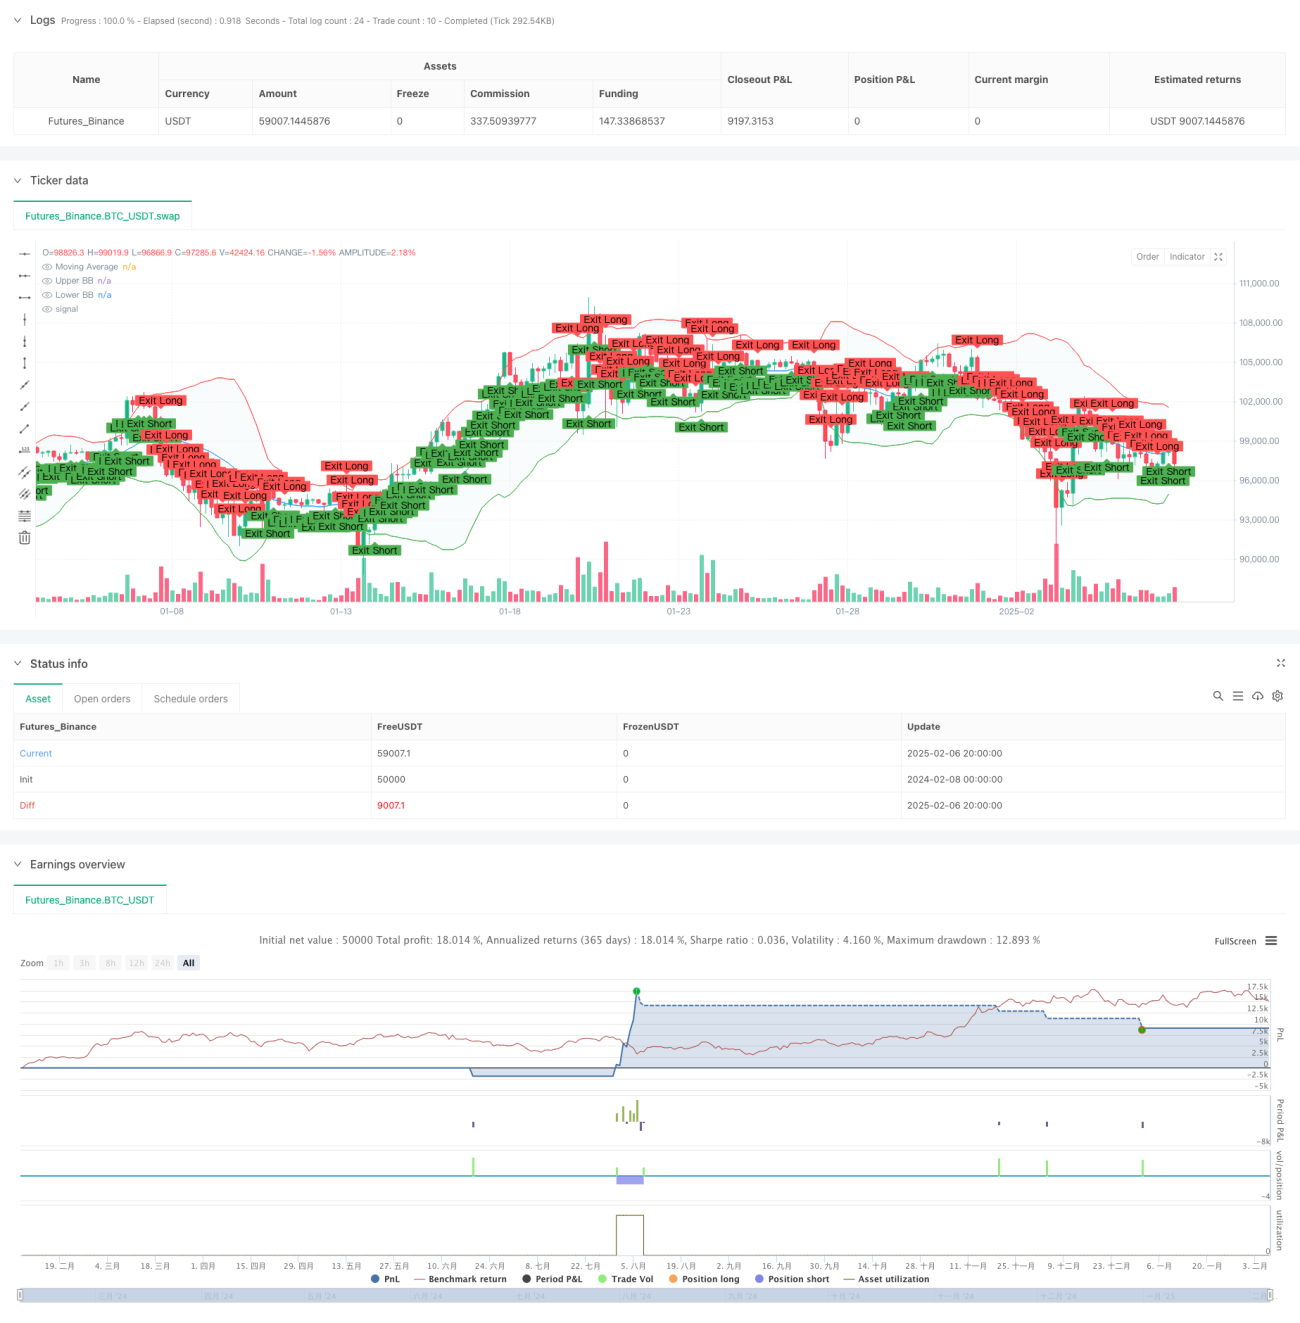
/*backtest
start: 2024-02-08 00:00:00
end: 2025-02-07 00:00:00
period: 4h
basePeriod: 4h
exchanges: [{"eid":"Futures_Binance","currency":"BTC_USDT"}]
*/

//@version=5
strategy("Bollinger Bands + Moving Average Strategy", overlay=true, default_qty_type=strategy.percent_of_equity, default_qty_value=200)

// === Vstupy ===- 1