
Overview
This is a trend-following trading system based on multiple indicators, combining Exponential Moving Averages (EMA), MACD indicator, RSI indicator, and volume analysis. The strategy analyzes the relationships between short-term, medium-term, and long-term moving averages, combined with momentum indicators and volume confirmation to execute trades when market trends are clear. The system also incorporates support and resistance analysis to further enhance trading accuracy.
Strategy Principles
The strategy is based on the following core elements:
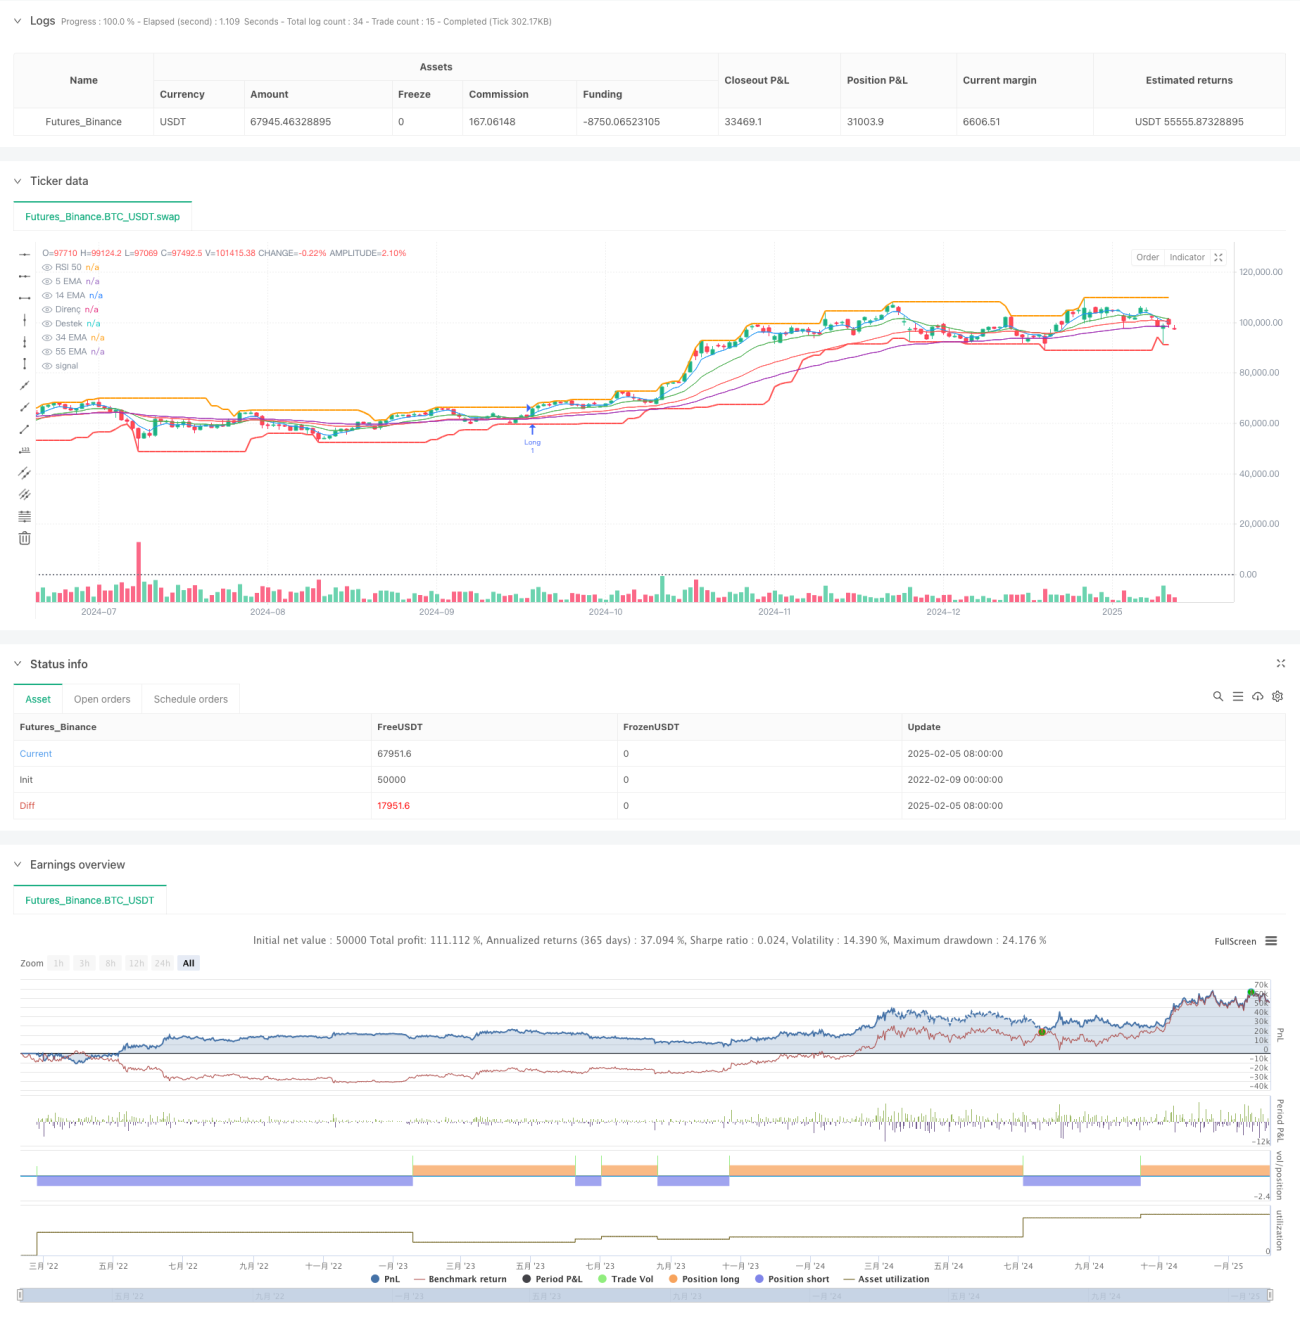
- Multiple EMA System: Uses 5, 14, 34, and 55-period EMAs to confirm trend direction. An uptrend is identified when shorter-period EMAs are above longer-period EMAs, and vice versa.
- MACD Indicator: Confirms market momentum. Positive MACD histogram indicates strong upward momentum; negative values indicate strong downward momentum.
- RSI Indicator: Confirms market strength/weakness. RSI above 50 indicates market strength, below 50 indicates market weakness.
- Volume Analysis: Requires volume to be 1.5 times greater than the 20-period volume average to ensure sufficient market activity.
- Support/Resistance Levels: Calculates short-term support and resistance levels using 20-period high and low prices.
Strategy Advantages
- Multi-dimensional Analysis: Combines multiple technical indicators to reduce false signals.
- Trend Confirmation: Uses multiple moving average system for more accurate trend identification.
- Momentum Verification: Combines MACD and RSI to confirm trends while avoiding chasing extremes.
- Volume-Price Integration: Uses volume as a necessary condition for trade confirmation.
- Risk Control: Provides reference points for stop-loss and take-profit through support/resistance analysis.
Strategy Risks
- Choppy Market Risk: May generate frequent false signals in range-bound markets.
- Lag Risk: Strategy has inherent lag due to the use of multiple moving averages.
- Cost Risk: Frequent trading may result in high transaction costs.
- Market Environment Dependency: Strategy performs well in strong trend markets but may underperform in other conditions.
Optimization Directions
- Parameter Optimization: Optimize indicator periods through historical data backtesting.
- Stop-Loss Optimization: Add dynamic stop-loss mechanisms like trailing stops or ATR-based stops.
- Market Environment Classification: Add market environment assessment module to use different parameters in different conditions.
- Signal Filtering: Add trend strength filters to avoid trading in weak trend environments.
- Position Management: Implement dynamic position sizing based on signal strength.
Summary
This strategy is a comprehensive trend-following system that combines multiple technical indicators to ensure trading reliability while maintaining risk control capabilities. Its core strength lies in its multi-dimensional analysis approach, although market conditions significantly impact its performance. Through continuous optimization and refinement, the strategy has the potential to achieve better results in actual trading.
- 1