Multi-Dimensional Trend Following Strategy with Volatility-Adaptive Stop Loss

Overview
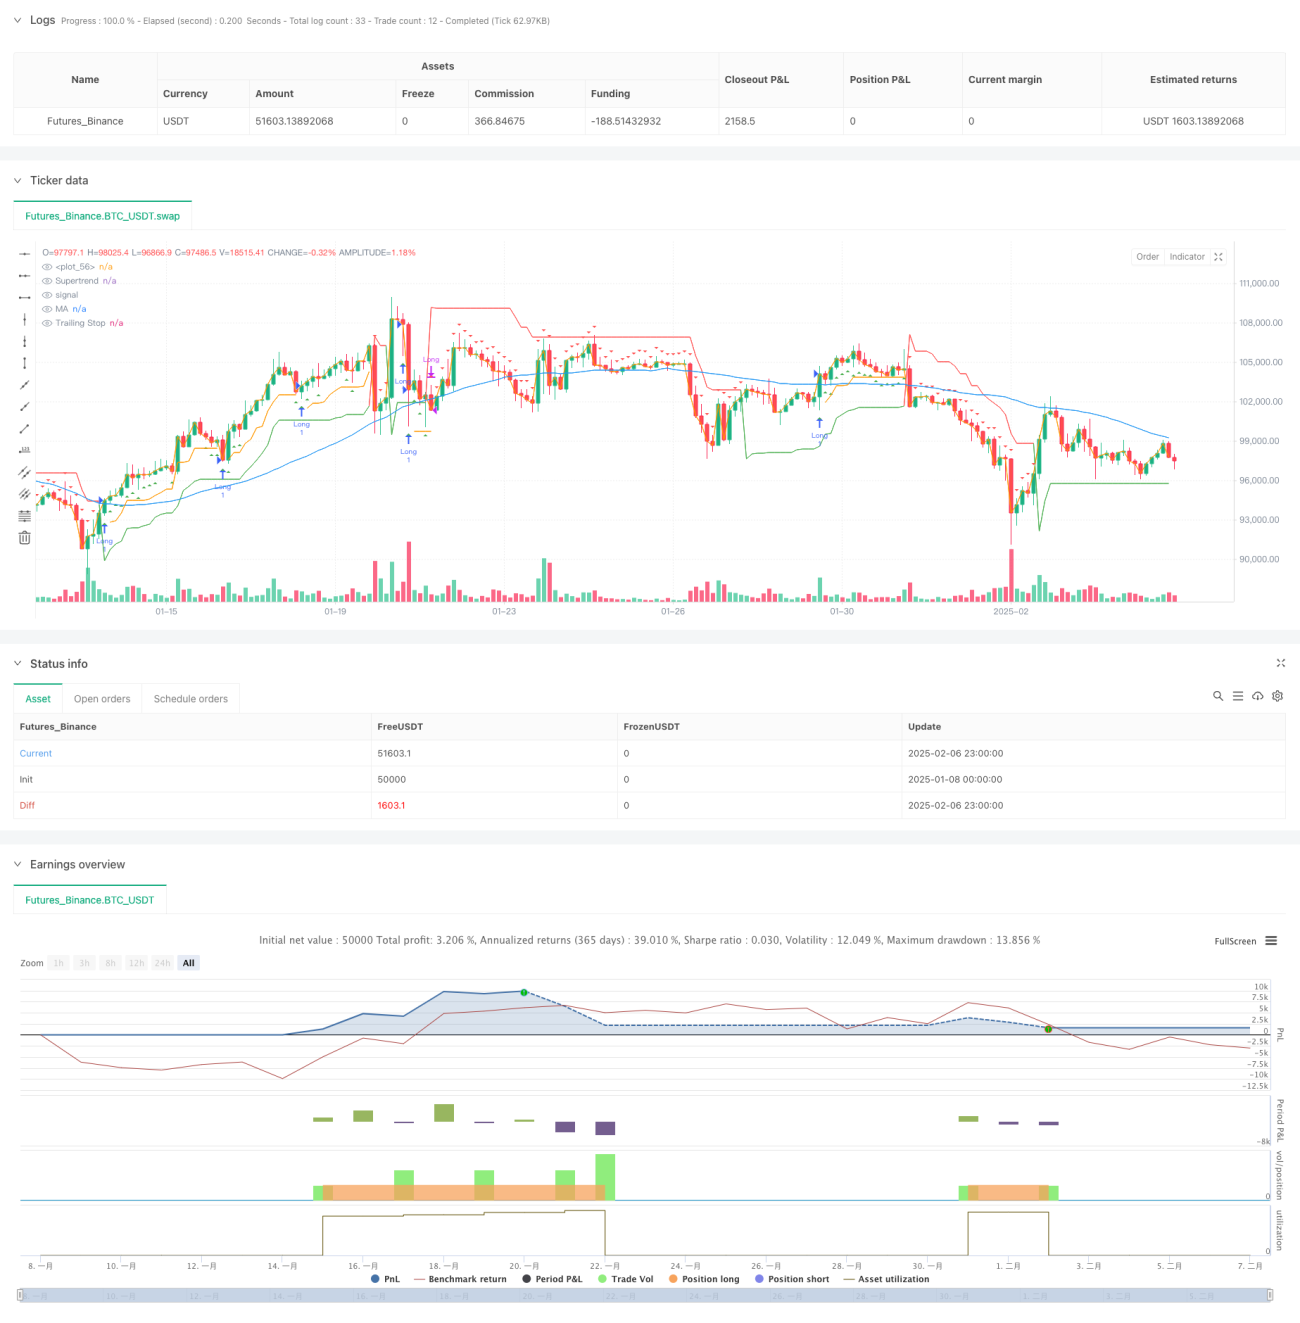
This strategy is a multi-dimensional trading system that combines trend following, momentum indicators, and adaptive stop-loss mechanisms. It identifies market trends using the SuperTrend indicator, confirms trades with RSI momentum indicator and moving average system, and implements dynamic stop-loss management using ATR volatility indicator. This multi-dimensional analysis approach effectively captures market trends while maintaining reasonable risk control.
Strategy Principles
The core logic is based on three dimensions:
- Trend Identification: Uses SuperTrend indicator (Parameters: ATR length 14, multiplier 3.0) as the primary trend determination tool. When SuperTrend turns green, it indicates a potential uptrend.
- Momentum Confirmation: Uses RSI indicator (Parameter: length 14) to avoid entering at overbought levels. RSI below 65 suggests the market is not overbought.
- Trend Validation: Uses 50-period Simple Moving Average (SMA) as additional trend confirmation. Price must be above the moving average to consider entry.
Buy conditions require: SuperTrend bullish (green) + RSI < 65 + Price above 50-period SMA.
Sell condition: Exit when SuperTrend turns bearish.
Stop-loss management: Uses ATR-based trailing stop, with stop distance set at 1.5 times ATR value.
Strategy Advantages
- Multi-dimensional Analysis: Combines multiple technical indicators to enhance signal reliability.
- Strong Adaptability: ATR-based stop-loss automatically adjusts according to market volatility.
- Comprehensive Risk Control: Trailing stop mechanism protects profits while allowing trends to develop.
- Reasonable Parameter Settings: Indicator parameters align with market dynamics, such as using 65 as RSI threshold instead of traditional 70.
- Clear Code Structure: Strategy code is highly modularized, facilitating maintenance and optimization.
Strategy Risks
- Choppy Market Risk: May generate frequent false signals in range-bound markets.
- Slippage Risk: Trailing stops may experience price deviation due to slippage in fast-moving markets.
- Parameter Sensitivity: Strategy performance is sensitive to SuperTrend and RSI parameter settings.
- Delay Risk: Lagging indicators like moving averages may cause delayed entries and exits.
Strategy Optimization Directions
- Market Environment Adaptation: Add volatility filters to adjust stop multipliers in high volatility environments.
- Entry Optimization: Consider adding volume confirmation indicators to improve entry signal reliability.
- Position Management: Introduce ATR-based dynamic position sizing system for adaptive risk exposure adjustment.
- Timeframe Optimization: Test performance across different timeframes to select optimal time periods.
- Dynamic Parameter Adjustment: Research methods for dynamic parameter optimization to improve strategy adaptability across different market conditions.
Summary
This strategy constructs a logically complete trading system through the comprehensive use of trend following, momentum, and moving average systems. Its strengths lie in its multi-dimensional signal confirmation mechanism and comprehensive risk control system. Through the provided optimization directions, there is room for further improvement. The key is to enhance its adaptability across different market conditions while maintaining the strategy's core logic.
- 1