Overview
This strategy is a multi-dimensional quantitative trading system that combines Exponential Moving Averages (EMA), Moving Average Convergence Divergence (MACD), and Relative Strength Index (RSI). By integrating trend following, momentum confirmation, and overbought/oversold analysis, it establishes a comprehensive trading decision framework. The strategy’s core lies in capturing market trends through EMA crossovers while confirming trend strength with MACD momentum indicators and filtering extreme market conditions using RSI.
Strategy Principles
The strategy employs a triple signal confirmation mechanism: 1. EMA Dual System: Uses 12-period and 26-period exponential moving averages as primary trend indicators, identifying trend changes through fast-slow line crossovers. 2. MACD System: Calculates MACD based on 12 and 26 periods, using a 9-period signal line to determine momentum changes through crossovers. 3. RSI Filter: Employs 14-period RSI with 70 and 30 as overbought/oversold thresholds to filter extreme market conditions.
Combined signals form trading conditions: - Long Entry: EMA12 crosses above EMA26 + MACD crosses above signal line + RSI below 70 - Exit: EMA12 crosses below EMA26 + MACD crosses below signal line + RSI above 30
Strategy Advantages
- High Signal Reliability: Multiple technical indicator confirmation significantly reduces false signals.
- Comprehensive Risk Control: RSI filtering effectively prevents inappropriate trades in extreme market conditions.
- Accurate Trend Capture: EMA dual system effectively tracks medium to long-term trends.
- Clear Execution Logic: Well-defined entry and exit conditions facilitate programmatic implementation and backtesting.
- High Adaptability: Indicator parameters can be flexibly adjusted for different market environments.
Strategy Risks
- Signal Lag: Moving average indicators inherently have some delay, potentially causing delayed entries.
- Sideways Market Risk: Frequent crossover signals in range-bound markets may lead to overtrading.
- Signal Conflict Risk: Multiple indicators may generate contradictory signals.
- Parameter Sensitivity: Strategy performance is sensitive to indicator parameter settings.
Optimization Directions
- Dynamic Parameter Optimization: Introduce adaptive parameter adjustment based on market volatility.
- Market Environment Classification: Add market state recognition to apply different signal weights in various market conditions.
- Stop-Loss Enhancement: Implement dynamic stop-loss mechanisms based on ATR or volatility.
- Position Management: Introduce volatility-based dynamic position sizing system.
- Signal Weighting System: Establish dynamic indicator signal weights based on historical accuracy.
Summary
This strategy builds a comprehensive trading decision system through the synergistic operation of multiple technical indicators. It excels in trending markets and effectively controls risk through RSI filtering, making it suitable as a foundation for medium to long-term trend following systems. However, considering the lag inherent in moving average indicators, it’s recommended to combine market environment analysis and implement further optimizations through dynamic parameter adjustment and position management in practical applications.
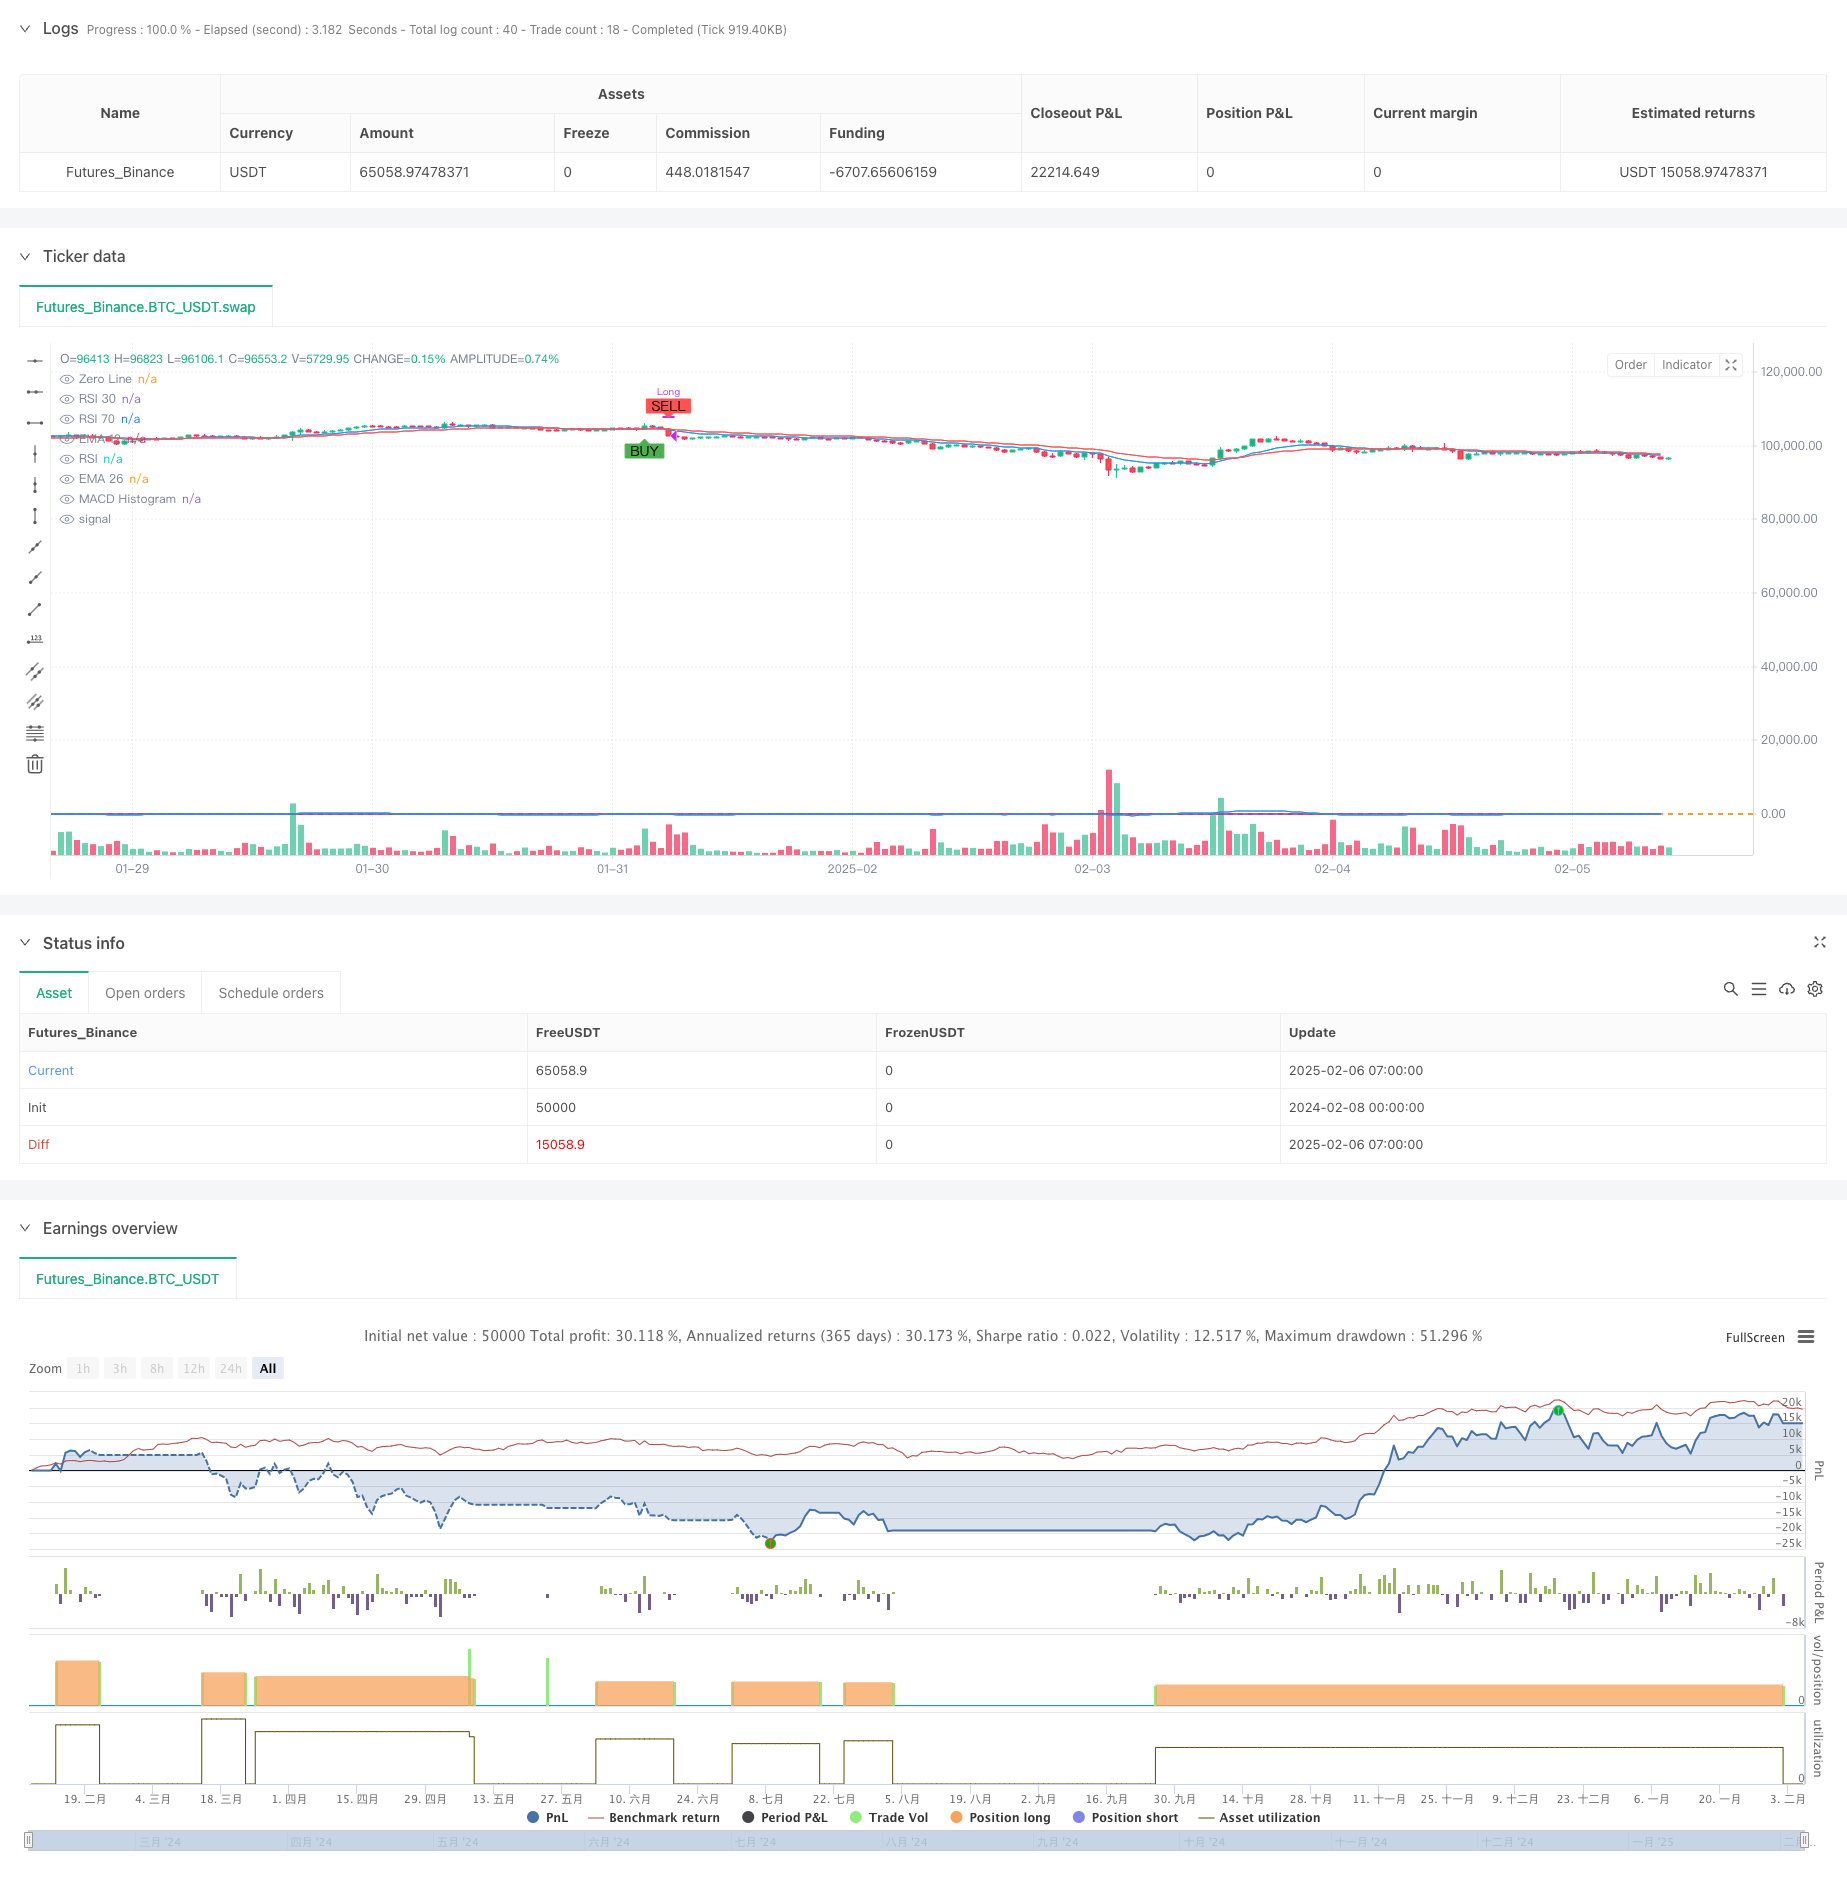
/*backtest
start: 2024-02-08 00:00:00
end: 2025-02-06 08:00:00
period: 1h
basePeriod: 1h
exchanges: [{"eid":"Futures_Binance","currency":"BTC_USDT"}]
*/

//@version=5
strategy("EMA12 + EMA26 + MACD + RSI Strategy", overlay=true, default_qty_type=strategy.percent_of_equity, default_qty_value=200)

// EMA calculations
ema12 = ta.ema(close, 12)
ema26 = ta.ema(close, 26)

// MACD calculations
[macdLine, signalLine, _] = ta.macd(close, 12, 26, 9)

// RSI calculation
rsi = ta.rsi(close, 14)

// Plot EMAs
plot(ema12, color=color.blue, title="EMA 12")
plot(ema26, color=color.red, title="EMA 26")

// Plot MACD Histogram
hline(0, "Zero Line", color=color.gray)
plot(macdLine - signalLine, color=color.blue, title="MACD Histogram")

// Plot RSI
hline(30, "RSI 30", color=color.orange)
hline(70, "RSI 70", color=color.orange)
plot(rsi, color=color.purple, title="RSI")

// Buy condition: EMA12 crosses above EMA26, MACD crosses above signal, RSI below 70
buyCondition = ta.crossover(ema12, ema26) and ta.crossover(macdLine, signalLine) and rsi < 70

// Sell condition: EMA12 crosses below EMA26, MACD crosses below signal, RSI above 30
sellCondition = ta.crossunder(ema12, ema26) and ta.crossunder(macdLine, signalLine) and rsi > 30

// Plot buy/sell signals
plotshape(series=buyCondition, title="Buy Signal", location=location.belowbar, color=color.green, style=shape.labelup, text="BUY")
plotshape(series=sellCondition, title="Sell Signal", location=location.abovebar, color=color.red, style=shape.labeldown, text="SELL")

// Execute trades
if (buyCondition)
    strategy.entry("Long", strategy.long)

if (sellCondition)
    strategy.close("Long")