
Overview
This strategy is a dynamic trend-following system based on technical analysis, primarily utilizing dual moving averages (200-day SMA and 21-week EMA) to identify market trends. The strategy integrates the Relative Strength Index (RSI) and Average Directional Index (ADX) as momentum filters, combined with Average True Range (ATR) for dynamic risk management, achieving precise capture of uptrends and effective risk control.
Strategy Principles
The core logic of the strategy is built on several key elements:
- Uses dual confirmation from 200-day Simple Moving Average (SMA) and 21-week Exponential Moving Average (EMA) to define bullish market conditions
- Ensures continued upward momentum through RSI>50 condition
- Validates trend strength with ADX>25 condition
- Implements dynamic stop-loss based on ATR, providing risk control adapted to market volatility
- Employs percentage-based take-profit mechanism to secure gains at predetermined levels
Strategy Advantages
- System demonstrates good adaptability with dynamic stop-loss adjustment based on market volatility
- Dual moving average crossover provides reliable trend confirmation signals, effectively reducing false breakout risks
- Combination of RSI and ADX significantly improves entry signal quality
- Highly customizable strategy parameters facilitate optimization for different market environments
- Daily timeframe trading reduces transaction costs and short-term volatility impact
Strategy Risks
- May generate frequent false signals in ranging markets, increasing transaction costs
- Moving average strategies inherently lag, potentially missing early trend gains
- Multiple filter conditions might cause missed trading opportunities
- ATR-based stops may become too wide in highly volatile markets
- Fixed percentage take-profit might exit profitable positions too early in strong trends
Strategy Optimization Directions
- Consider incorporating volume indicators for signal confirmation
- Implement dynamic take-profit mechanism to better adapt to different market phases
- Optimize RSI and ADX parameters to improve signal timeliness
- Add trend strength classification for dynamic position management
- Introduce volatility indicators to adjust trading frequency during high volatility periods
Summary
This is a well-designed trend-following strategy with clear logic, effectively balancing returns and risks through multiple technical indicators. The strategy's high customizability makes it suitable for maintaining effectiveness across different market environments through parameter optimization. While it carries some inherent lag risks, the comprehensive risk control mechanisms contribute to overall stability and reliability.
/*backtest
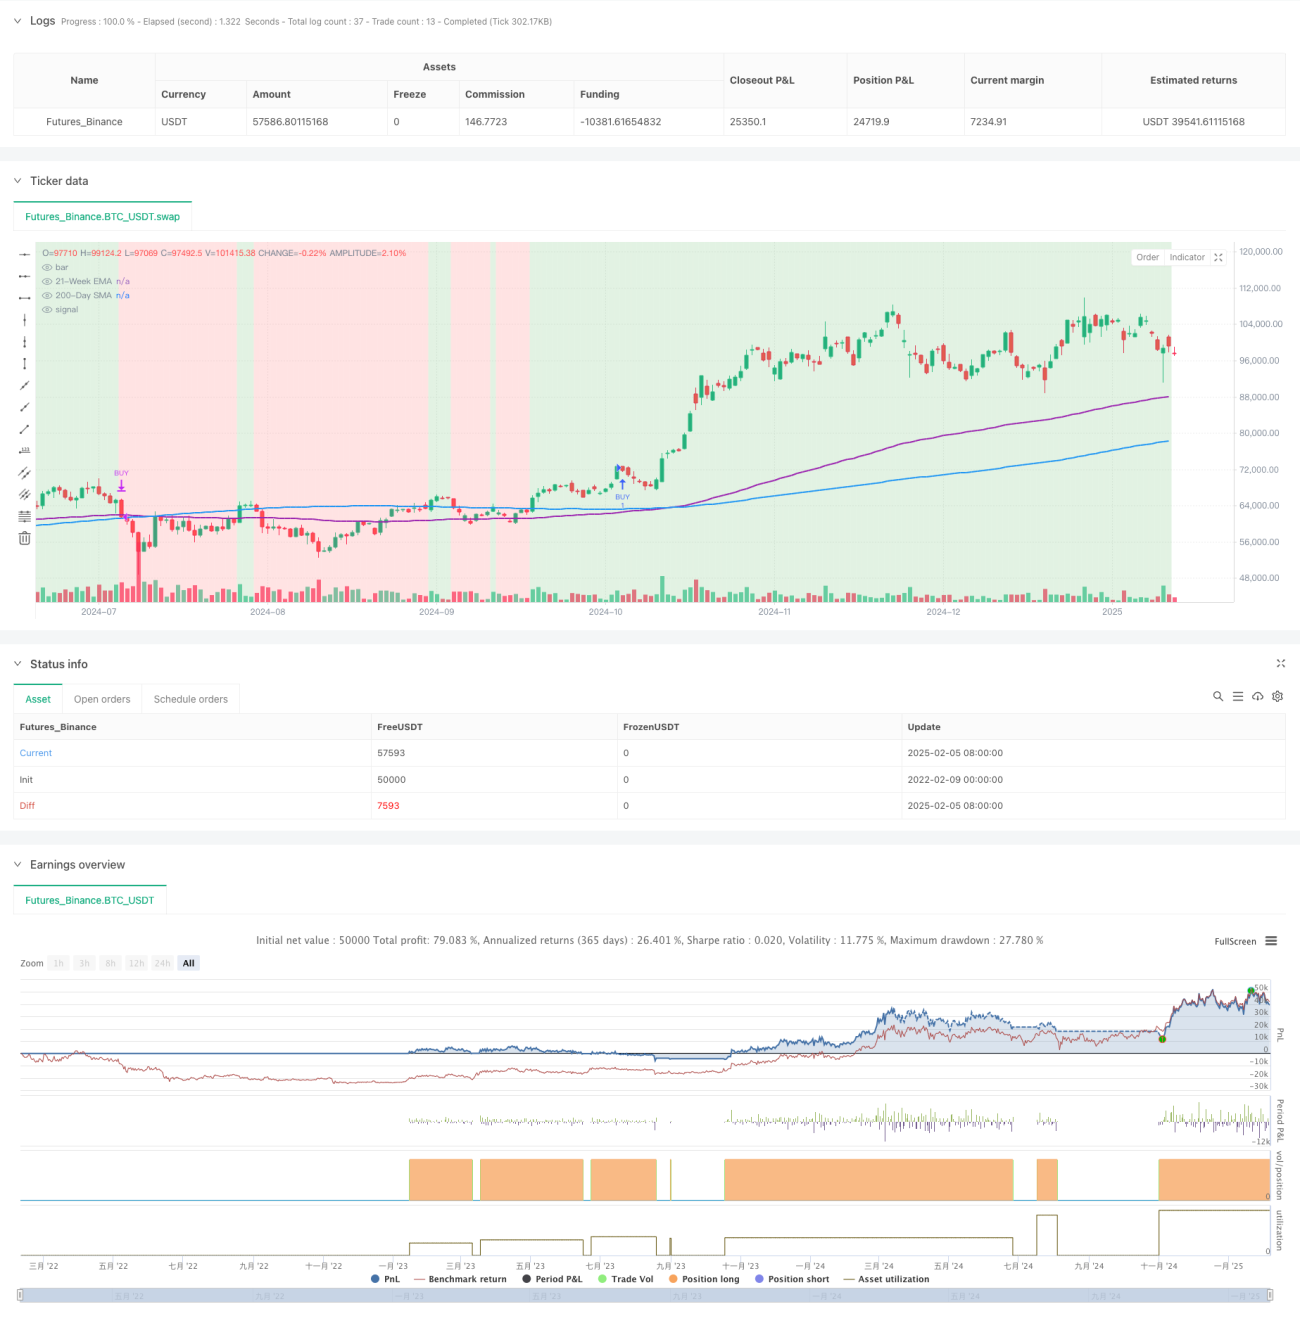
start: 2022-02-09 00:00:00
end: 2025-02-06 08:00:00
period: 1d
basePeriod: 1d
exchanges: [{"eid":"Futures_Binance","currency":"BTC_USDT"}]
*/
//@version=6
strategy("BTCUSDT Daily - Enhanced Bitcoin Bull Market Support [CYRANO]", shorttitle="BTCUSDT Daily BULL MARKET", overlay=true, commission_type=strategy.commission.percent, commission_value=0.1, slippage=3)
// Inputs- 1