Triple EMA Crossover Trend Following Strategy with RSI and Volume Confirmation System

Overview
This strategy is a trend-following trading system based on multiple technical indicators, combining EMA crossovers, momentum indicators, and volume confirmation to identify high-probability trading opportunities. Through appropriate stop-loss and profit targets, the strategy pursues higher reward-to-risk ratios while controlling risks. It is primarily designed for trend trading on larger timeframes and can be applied to multiple markets including cryptocurrencies, forex, and stocks.
Strategy Principles
The core logic of the strategy is based on the following key elements:
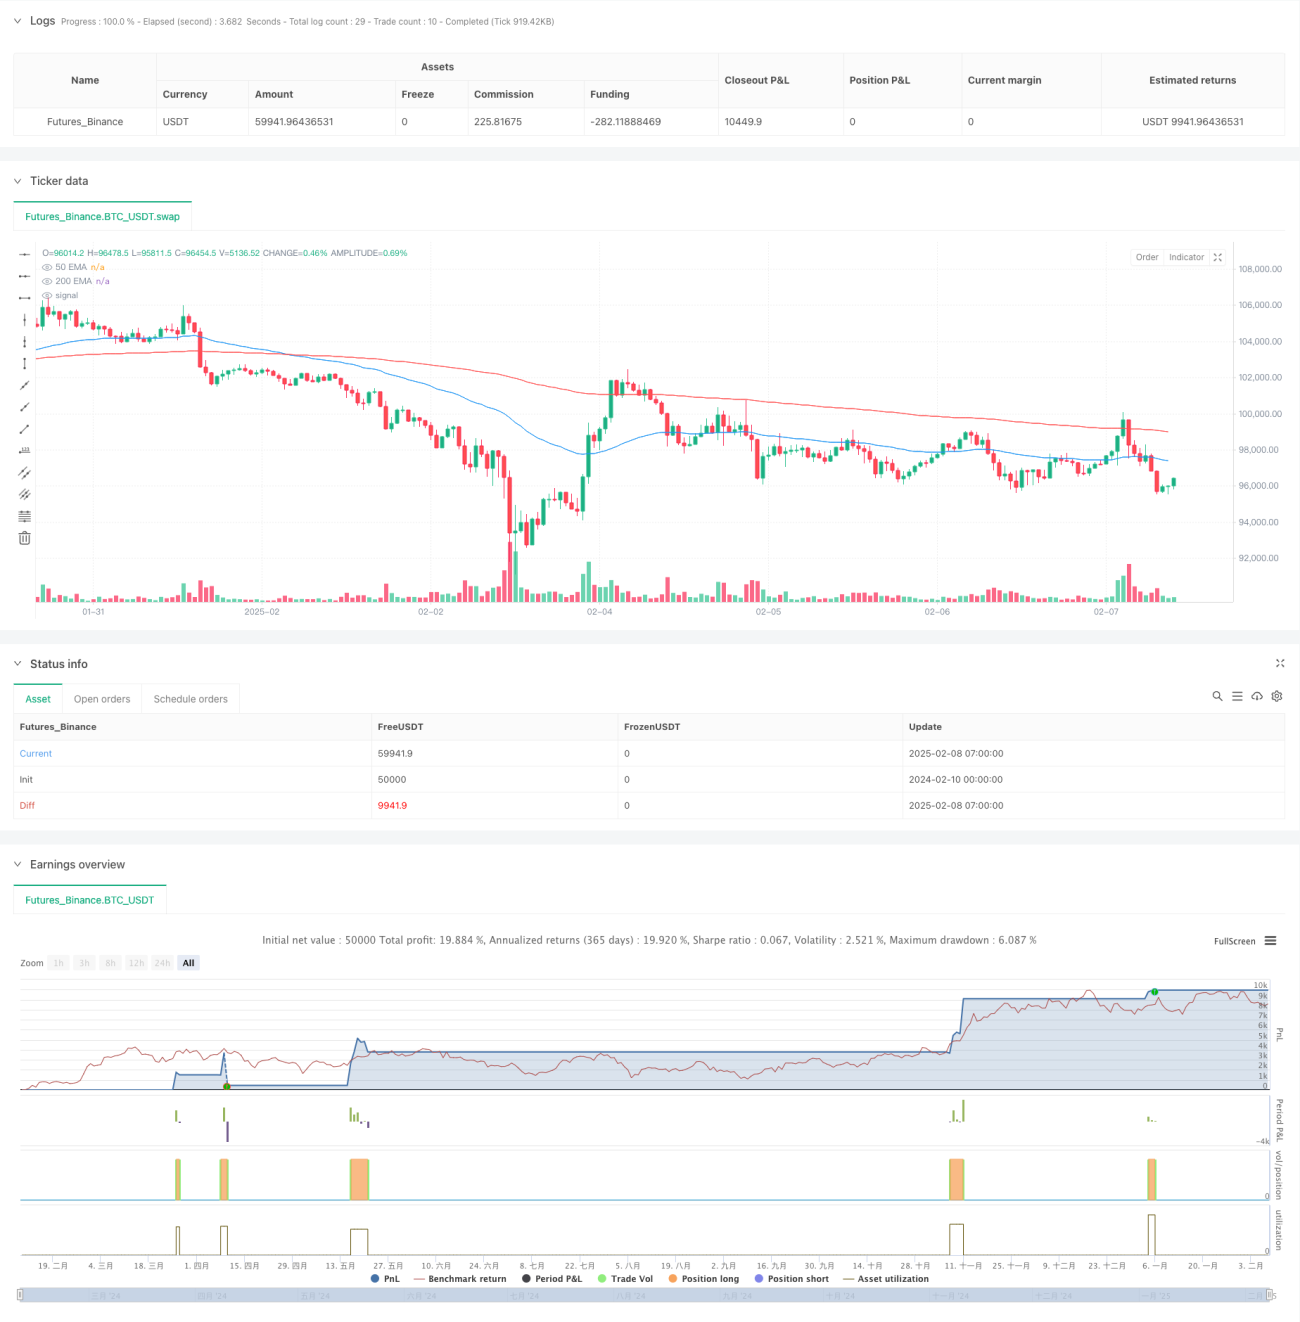
- Uses 50-day and 200-day exponential moving averages (EMA) for trend direction determination, generating long signals when the short-term EMA crosses above the long-term EMA, and vice versa.
- Incorporates Relative Strength Index (RSI) for momentum confirmation, with RSI above 50 indicating upward momentum and below 50 indicating downward momentum.
- Validates trading signals through volume comparison with 1.5 times the 20-day average volume, ensuring trades are only executed during volume expansion.
- Dynamically sets stop-loss positions based on 14-day Average True Range (ATR), placing stops 1.5 ATR below recent lows.
- Implements a 3:1 reward-to-risk ratio for profit targeting, setting profit targets at three times the stop-loss distance.
Strategy Advantages
- Multiple signal confirmation mechanism significantly improves trading accuracy, avoiding false signals from single indicators.
- Dynamic stop-loss setting adapts to market volatility changes, providing better risk protection.
- 3:1 reward-to-risk ratio allows for profitability even with lower win rates.
- Strategy operation on larger timeframes filters out short-term market noise, capturing major trends.
- Demonstrates good market adaptability, applicable across different trading instruments.
Strategy Risks
- May generate frequent false breakout signals in ranging markets, leading to consecutive stops.
- Strict signal confirmation criteria might miss potential trading opportunities.
- Fixed 3:1 reward-to-risk ratio setting may be overly idealistic in certain market conditions.
- Reliance on volume indicators may be affected by market manipulation in certain markets (e.g., cryptocurrencies).
Strategy Optimization Directions
- Introduce adaptive EMA periods for better adaptation to different market cycles.
- Consider adding trend strength indicators for more aggressive position management in strong trends.
- Develop dynamic reward-to-risk ratio mechanisms that adjust based on market volatility.
- Add market state identification modules for different parameter settings in various market conditions.
- Optimize volume confirmation threshold calculations for better adaptability.
Summary
The strategy constructs a robust trend-following system through triple confirmation mechanisms of EMA crossovers, RSI momentum, and volume. The 3:1 reward-to-risk ratio provides good profit potential, while the ATR-based dynamic stop-loss mechanism offers necessary risk protection. Although the strategy may underperform in ranging markets, through the suggested optimization directions, its adaptability and stability can be further enhanced.
- 1