
Overview
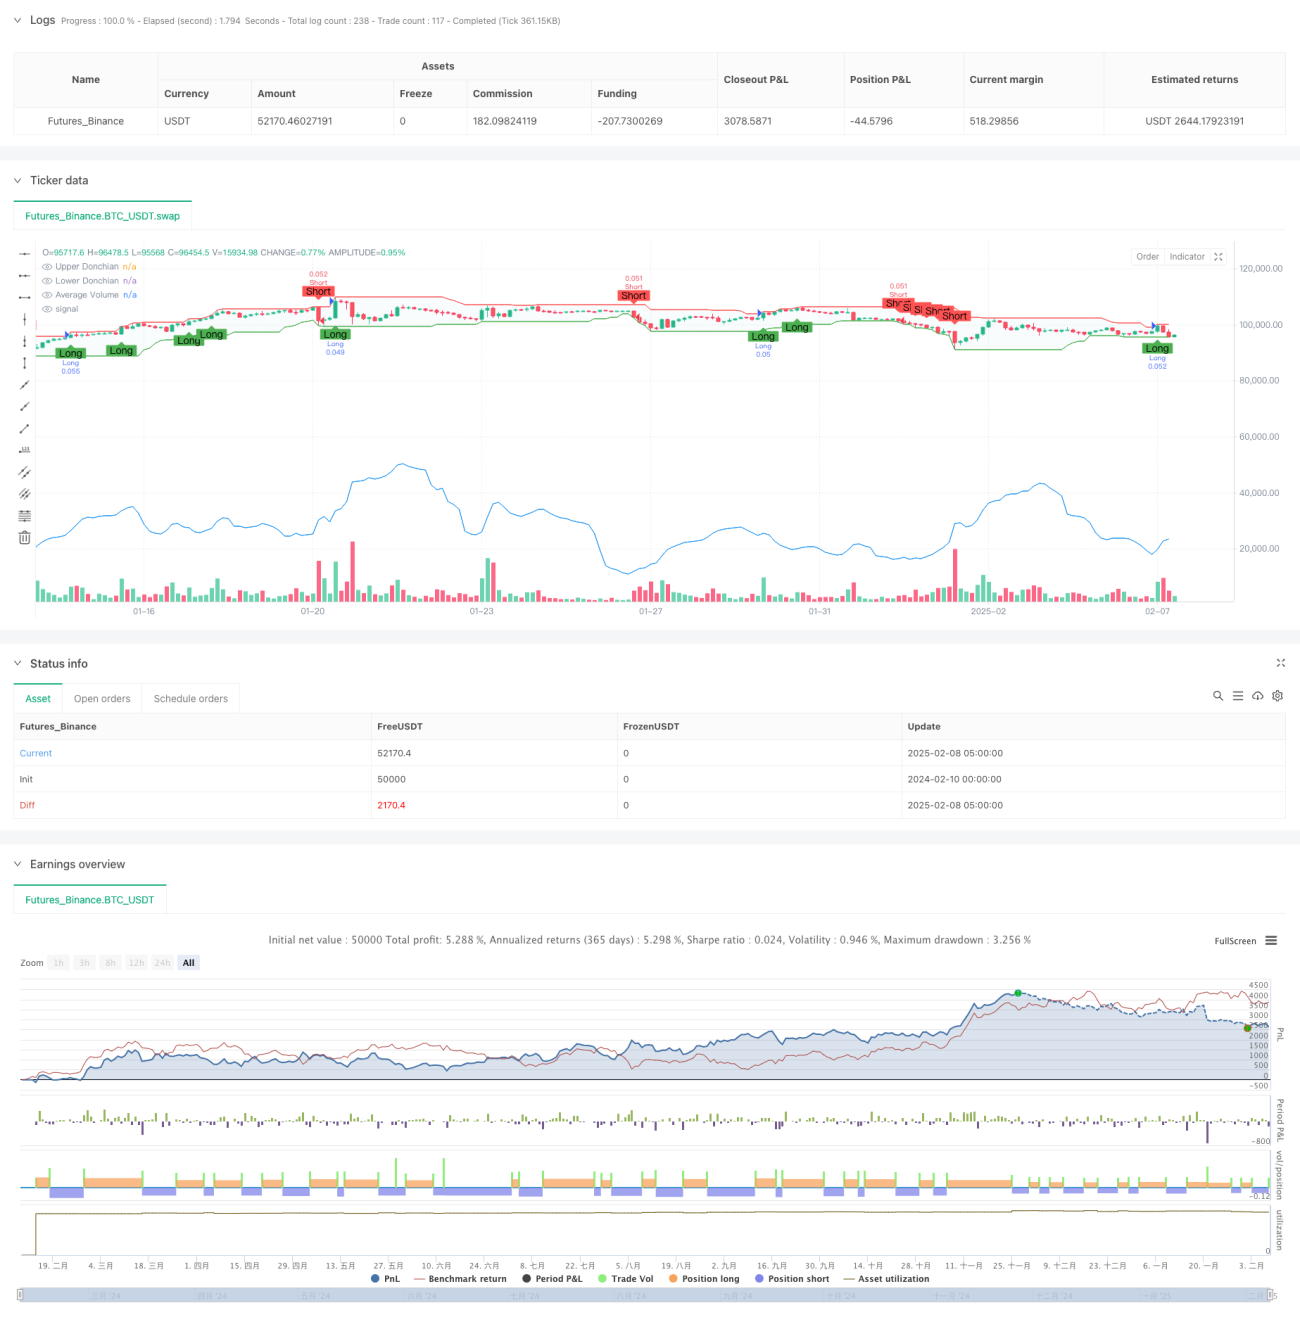
This strategy combines Donchian Channels with volume analysis for trend breakout trading. It identifies market trend reversals through dynamic support and resistance breakouts, validated by volume confirmation. The core concept lies in using volume expansion to verify price breakouts, thereby improving trading success rates.
Strategy Principles
The strategy operates based on two main technical indicators:
- Donchian Channels: Tracks the highest high and lowest low over a specified period, forming dynamic support and resistance levels.
- Volume SMA: Used to confirm the validity of price breakouts.
Trade signal generation logic:
- Long entry: Price breaks above upper channel with volume above average
- Short entry: Price breaks below lower channel with volume above average
- Exit conditions: Automatic exit based on reverse channel breakout
Strategy Advantages
- Objective and quantifiable: Based on clear mathematical indicators, reducing subjective judgment
- Dynamic adaptation: Channels adjust with market volatility, suitable for different market conditions
- Risk control: Clear entry and exit conditions
- Volume confirmation: Improves breakout signal reliability through volume analysis
- Fully automated: Clear strategy logic, easy to implement programmatically
Strategy Risks
- False breakout risk: Market may exhibit false breakouts leading to losses
- Slippage risk: Higher slippage during volatile periods
- Sideways market inefficiency: May generate frequent false signals in ranging markets
- Parameter sensitivity: Strategy performance highly dependent on parameter selection
- Market environment dependency: Performance varies significantly across different market conditions
Optimization Directions
- Implement trend filters: Add trend confirmation indicators to reduce false breakouts
- Optimize stop-loss strategy: Design more flexible stop-loss mechanisms
- Enhance volume analysis: Consider volume rate of change and other factors
- Market environment recognition: Add market condition identification logic
- Parameter adaptation: Implement dynamic parameter optimization
Summary
This strategy combines Donchian Channels and volume analysis to create a relatively reliable trend breakout trading system. Its strengths lie in objectivity and quantifiability, while requiring attention to risks such as false breakouts and market environment dependency. Through continuous optimization and improvement, the strategy shows potential for better performance in actual trading.
/*backtest
start: 2024-02-10 00:00:00
end: 2025-02-08 08:00:00
period: 3h
basePeriod: 3h
exchanges: [{"eid":"Futures_Binance","currency":"BTC_USDT"}]
*/

//@version=5
strategy("Donchian Channels + Volume Strategy", overlay=true, default_qty_type=strategy.percent_of_equity, default_qty_value=10)

// === Vstupy ===- 1