Multi-Timeframe Market Exhaustion Analysis Strategy with Risk Management System

ATR RRR SL TP DD
Created on: 2025-02-10 14:27:15 Modified on: 2025-02-10 14:27:15
Copy: 1 Number of hits: 370
avatar of ChaoZhang ChaoZhang
1
Follow
1617
Followers

 Multi-Timeframe Market Exhaustion Analysis Strategy with Risk Management System

Overview

This strategy is a multi-level trading system based on market exhaustion analysis, designed to identify potential market turning points through in-depth price dynamics analysis. It incorporates dynamic risk management mechanisms, including money management, stop-loss optimization, and drawdown control, forming a comprehensive trading decision framework.

Strategy Principles

The core mechanism analyzes market exhaustion through continuous price movement monitoring. Specifically: 1. Determines trend direction by comparing current closing price with the 4th previous candle 2. Implements three different signal strength levels (9/12/14) 3. Accumulates signal counts when price moves consistently in one direction 4. Triggers corresponding level signals when preset thresholds are reached 5. Integrates ATR-based dynamic stop-loss and position sizing based on risk-reward ratio

Strategy Advantages

  1. Multi-level signal system provides varied trading opportunity identification
  2. Protects capital through money management and risk control mechanisms
  3. Uses ATR-based dynamic stop-loss for better market adaptation
  4. Incorporates trailing stop mechanism for better profit protection
  5. Implements maximum drawdown protection to prevent excessive losses
  6. System offers good extensibility and parameter optimization potential

Strategy Risks

  1. May generate false signals in ranging markets
  2. Fixed signal thresholds might not suit all market conditions
  3. Potential larger stops in quick reversal scenarios
  4. Requires significant parameter optimization work
  5. Money management system may limit profit potential in certain situations

Optimization Directions

  1. Introduce volatility filtering to adjust signal thresholds in different market conditions
  2. Add volume analysis dimension to improve signal reliability
  3. Develop adaptive parameter optimization system
  4. Incorporate additional market environment indicators
  5. Optimize money management system for greater flexibility

Summary

The strategy provides a systematic trading framework through multi-level exhaustion analysis and comprehensive risk management. While there are areas for optimization, the overall design is complete and practically applicable. It is recommended to use conservative money management in live trading while continuously optimizing parameters and improving the system.
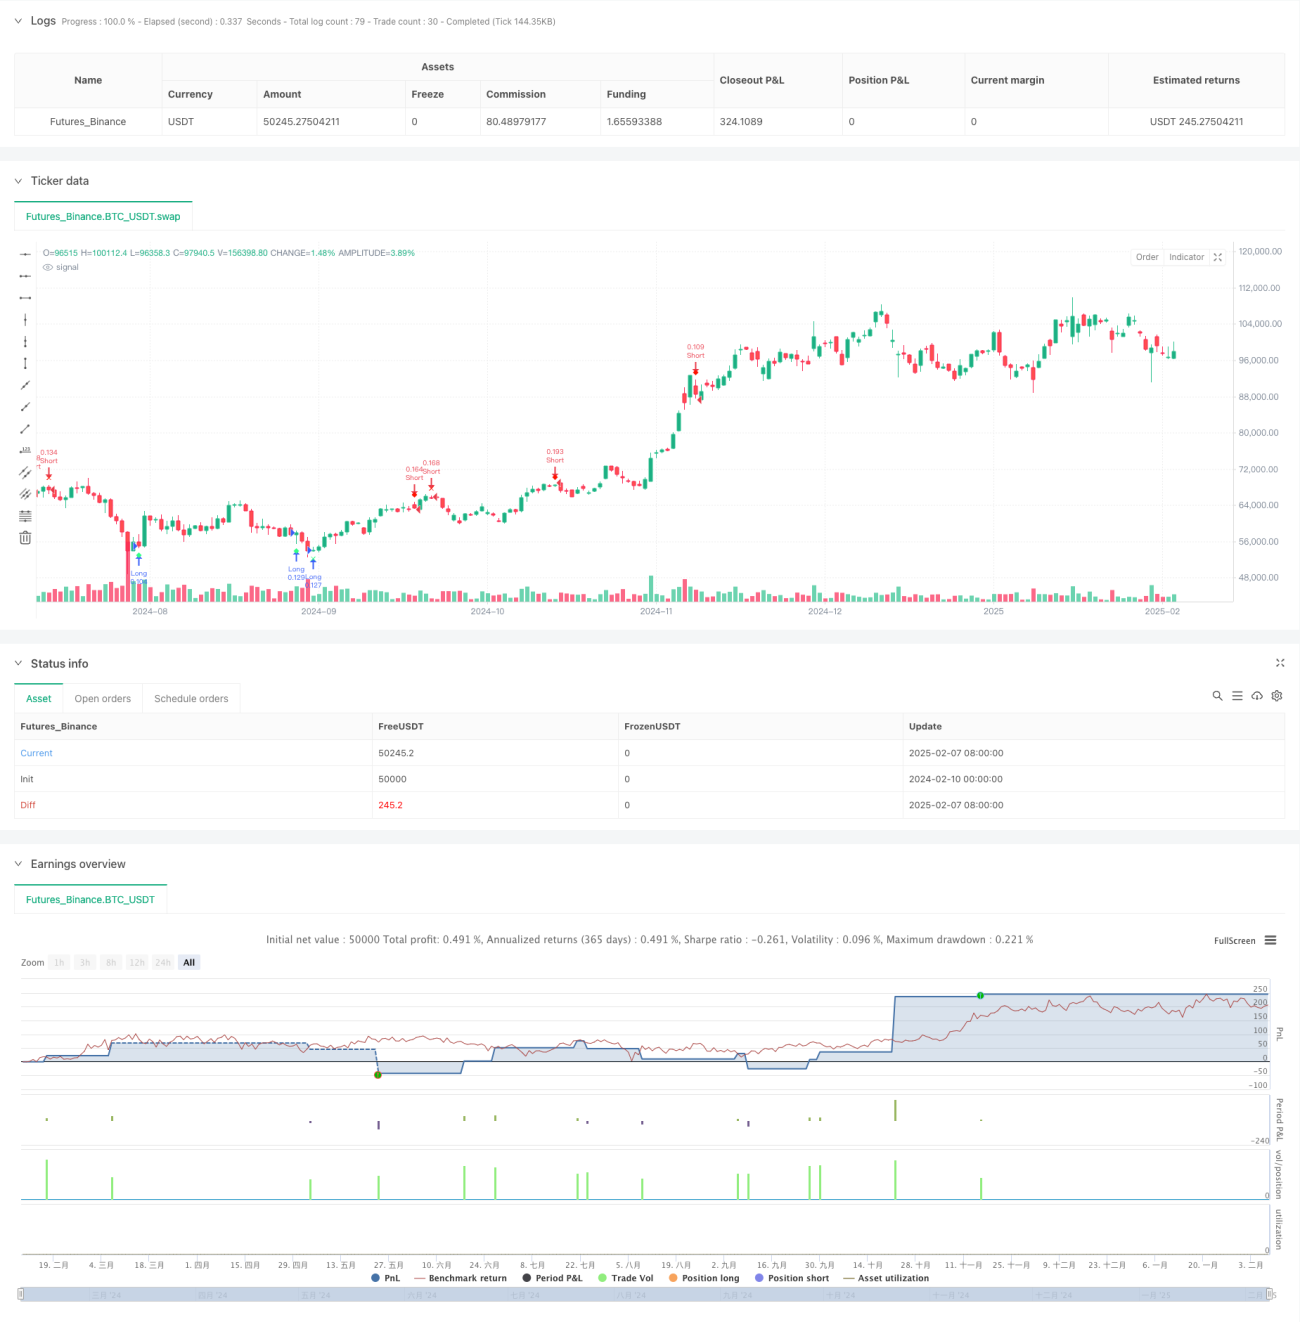
Strategy source code
/*backtest
start: 2024-02-10 00:00:00
end: 2025-02-08 08:00:00
period: 1d
basePeriod: 1d
exchanges: [{"eid":"Futures_Binance","currency":"BTC_USDT"}]
*/

//@version=6
strategy(title="Improved Exhaustion Signal with Risk Management and Drawdown Control", shorttitle="Exhaustion Signal", overlay=true)

// ———————————————— INPUT SETTINGS ————————————————
showLevel1 = input.bool(true, 'Show Level 1 Signals')
showLevel2 = input.bool(true, 'Show Level 2 Signals')
showLevel3 = input.bool(true, 'Show Level 3 Signals')

// Thresholds for signal strength levels
level1 = 9
level2 = 12
level3 = 14

// Risk management inputs
riskPercentage = input.float(1.0, title="Risk Percentage per Trade", minval=0.1, maxval=5.0)  // Risk per trade in percentage
riskRewardRatio = input.float(2.0, title="Risk-to-Reward Ratio", minval=1.0, maxval=5.0)  // Reward-to-risk ratio
trailingStop = input.bool(true, title="Enable Trailing Stop")  // Enable/Disable trailing stop
trailingStopDistance = input.int(50, title="Trailing Stop Distance (in points)", minval=1)  // Distance for trailing stop

// Drawdown protection settings
maxDrawdown = input.float(10.0, title="Max Drawdown Percentage", minval=0.1, maxval=50.0)  // Max allowable drawdown before stopping trading

// ———————————————— GLOBAL VARIABLES ————————————————
var int cycle = 0
var int bullishSignals = 0
var int bearishSignals = 0
var float equityHigh = na  // Initialize as undefined

// Track equity drawdown
if (na(equityHigh) or strategy.equity > equityHigh)
    equityHigh := strategy.equity

drawdownPercent = 100 * (equityHigh - strategy.equity) / equityHigh

// Stop trading if drawdown exceeds the limit
if drawdownPercent >= maxDrawdown
    strategy.close_all()

// ———————————————— FUNCTION: RESET & IMMEDIATE RECHECK USING AN ARRAY RETURN ————————————————
f_resetAndRecheck(_bullish, _bearish, _cycle, _close, _close4) =>
    newBullish = _bullish
    newBearish = _bearish
    newCycle = _cycle

    // Reset cycle if necessary based on price action
    newBullish := 0
    newBearish := 0
    newCycle := 0

    if _close < _close4
        newBullish := 1
        newCycle := newBullish
    else if _close > _close4
        newBearish := 1
        newCycle := newBearish

    resultArray = array.new_int(3, 0)
    array.set(resultArray, 0, newBullish)
    array.set(resultArray, 1, newBearish)
    array.set(resultArray, 2, newCycle)

    resultArray

// ———————————————— EXHAUSTION LOGIC ————————————————
if cycle < 9
    // Bullish cycle: close < close[4]
    if close < close[4]
        bullishSignals += 1
        bearishSignals := 0
        cycle := bullishSignals
    // Bearish cycle: close > close[4]
    else if close > close[4]
        bearishSignals += 1
        bullishSignals := 0
        cycle := bearishSignals
    else
        newVals = f_resetAndRecheck(bullishSignals, bearishSignals, cycle, close, close[4])
        bullishSignals := array.get(newVals, 0)
        bearishSignals := array.get(newVals, 1)
        cycle := array.get(newVals, 2)
else
    // ——— BULLISH checks ———
    if bullishSignals > 0
        if bullishSignals < (level3 - 1)
            if close < close[3]
                bullishSignals += 1
                bearishSignals := 0
                cycle := bullishSignals
            else
                newVals = f_resetAndRecheck(bullishSignals, bearishSignals, cycle, close, close[4])
                bullishSignals := array.get(newVals, 0)
                bearishSignals := array.get(newVals, 1)
                cycle := array.get(newVals, 2)
        else if bullishSignals == (level3 - 1)
            if close < close[2]
                bullishSignals := level3
                cycle := bullishSignals
            else
                newVals = f_resetAndRecheck(bullishSignals, bearishSignals, cycle, close, close[4])
                bullishSignals := array.get(newVals, 0)
                bearishSignals := array.get(newVals, 1)
                cycle := array.get(newVals, 2)
        else
            newVals = f_resetAndRecheck(bullishSignals, bearishSignals, cycle, close, close[4])
            bullishSignals := array.get(newVals, 0)
            bearishSignals := array.get(newVals, 1)
            cycle := array.get(newVals, 2)
    // ——— BEARISH checks ———
    else if bearishSignals > 0
        if bearishSignals < (level3 - 1)
            if close > close[3]
                bearishSignals += 1
                bullishSignals := 0
                cycle := bearishSignals
            else
                newVals = f_resetAndRecheck(bullishSignals, bearishSignals, cycle, close, close[4])
                bullishSignals := array.get(newVals, 0)
                bearishSignals := array.get(newVals, 1)
                cycle := array.get(newVals, 2)
        else if bearishSignals == (level3 - 1)
            if close > close[2]
                bearishSignals := level3
                cycle := bearishSignals
            else
                newVals = f_resetAndRecheck(bullishSignals, bearishSignals, cycle, close, close[4])
                bullishSignals := array.get(newVals, 0)
                bearishSignals := array.get(newVals, 1)
                cycle := array.get(newVals, 2)
        else
            newVals = f_resetAndRecheck(bullishSignals, bearishSignals, cycle, close, close[4])
            bullishSignals := array.get(newVals, 0)
            bearishSignals := array.get(newVals, 1)
            cycle := array.get(newVals, 2)
    else
        newVals = f_resetAndRecheck(bullishSignals, bearishSignals, cycle, close, close[4])
        bullishSignals := array.get(newVals, 0)
        bearishSignals := array.get(newVals, 1)
        cycle := array.get(newVals, 2)

// ———————————————— SIGNAL FLAGS ————————————————
bullishLevel1 = showLevel1 and (bullishSignals == level1)
bearishLevel1 = showLevel1 and (bearishSignals == level1)

bullishLevel2 = showLevel2 and (bullishSignals == level2)
bearishLevel2 = showLevel2 and (bearishSignals == level2)

bullishLevel3 = showLevel3 and (bullishSignals == level3)
bearishLevel3 = showLevel3 and (bearishSignals == level3)

// ———————————————— PLOT SIGNALS ————————————————
plotshape(bullishLevel1, style=shape.diamond, color=color.new(#30ff85, 0), textcolor=color.white, size=size.tiny, location=location.belowbar, title="Level 1 Bullish Signal")
plotshape(bearishLevel1, style=shape.diamond, color=color.new(#ff1200, 0), textcolor=color.white, size=size.tiny, location=location.abovebar, title="Level 1 Bearish Signal")

plotshape(bullishLevel2, style=shape.xcross, color=color.new(#30ff85, 0), textcolor=color.white, size=size.tiny, location=location.belowbar, title="Level 2 Bullish Signal")
plotshape(bearishLevel2, style=shape.xcross, color=color.new(#ff1200, 0), textcolor=color.white, size=size.tiny, location=location.abovebar, title="Level 2 Bearish Signal")

plotshape(bullishLevel3, style=shape.flag, color=color.new(#30ff85, 0), textcolor=color.white, size=size.tiny, location=location.belowbar, title="Level 3 Bullish Signal")
plotshape(bearishLevel3, style=shape.flag, color=color.new(#ff1200, 0), textcolor=color.white, size=size.tiny, location=location.abovebar, title="Level 3 Bearish Signal")

// ———————————————— RESET AFTER LEVEL 3 ————————————————
if bullishSignals == level3 or bearishSignals == level3
    bullishSignals := 0
    bearishSignals := 0
    cycle := 0

// ———————————————— BACKTEST LOGIC ————————————————
// Set up basic long and short entry conditions based on signal levels
longCondition = bullishLevel1 or bullishLevel2 or bullishLevel3
shortCondition = bearishLevel1 or bearishLevel2 or bearishLevel3

// Calculate position size based on risk percentage
equity = strategy.equity
riskAmount = equity * riskPercentage / 100
atr = ta.atr(14)
stopLossLevel = atr * 1.5  // Using ATR for dynamic stop-loss
positionSize = riskAmount / stopLossLevel

// Initialize strategy logic
if longCondition
    strategy.entry("Long", strategy.long, qty=positionSize)

if shortCondition
    strategy.entry("Short", strategy.short, qty=positionSize)

// ———————————————— CONCRETE STOP LOSS AND TAKE PROFIT ————————————————
stopLoss = stopLossLevel
takeProfit = stopLoss * riskRewardRatio

// Apply stop loss and take profit to the strategy based on concrete price levels
strategy.exit("Exit Long", from_entry="Long", stop=close - stopLoss, limit=close + takeProfit)
strategy.exit("Exit Short", from_entry="Short", stop=close + stopLoss, limit=close - takeProfit)

// ———————————————— TRAILING STOP ————————————————
if trailingStop
    strategy.exit("Exit Long Trailing", from_entry="Long", trail_price=close - trailingStopDistance, trail_offset=trailingStopDistance)
    strategy.exit("Exit Short Trailing", from_entry="Short", trail_price=close + trailingStopDistance, trail_offset=trailingStopDistance)