
Overview
This strategy is a comprehensive intraday trading system that combines multiple technical indicators. It primarily uses the crossover signals of fast and slow Exponential Moving Averages (EMA) as the main entry criteria, incorporates the Relative Strength Index (RSI) for momentum filtering, and utilizes the Average True Range (ATR) for dynamic stop-loss placement, forming a complete trading system. Through strict risk control and dynamic profit/loss settings, the strategy aims to capture short-term market fluctuations.
Strategy Principles
The core logic includes the following aspects:
- Trend Determination: Using 9-period and 21-period EMA crossovers to identify market trend direction
- Momentum Filtering: Employing 14-period RSI for overbought/oversold judgments to prevent counter-trend entries
- Risk Control: Setting dynamic stop-loss levels based on 14-period ATR with a multiplier of 1.5
- Profit Targets: Setting dynamic take-profit levels at 2 times ATR from entry point
Specific trading rules:
- Long Entry: Fast EMA crosses above Slow EMA with RSI below 70
- Short Entry: Fast EMA crosses below Slow EMA with RSI above 30
- Stop-Loss: Long positions set at 1.5 times ATR below entry, short positions at 1.5 times ATR above entry
- Take-Profit: Dynamic levels set at 2 times ATR from entry price
Strategy Advantages
- Multiple Indicator Confirmation: Combines trend and momentum indicators for improved signal reliability
- Dynamic Risk Management: Adapts stop-loss levels to market volatility using ATR
- Systematic Trading: Clear entry and exit conditions reduce subjective judgment
- Reasonable Risk-Reward Ratio: Balanced profit and loss settings for long-term stability
- High Adaptability: Parameters can be adjusted for different market characteristics
Strategy Risks
- Rapid Oscillation Risk: May generate frequent false breakout signals in ranging markets
- Slippage Impact: Intraday trading requires high execution efficiency
- Parameter Sensitivity: Optimal parameters may vary across different market environments
- Transaction Costs: Frequent trading may incur higher costs
Risk Control Suggestions:
- Conduct thorough historical data backtesting
- Consider adding trading filters
- Control position sizing appropriately
- Regular parameter effectiveness evaluation
Strategy Optimization Directions
- Enhanced Market Environment Filtering:
- Add volatility indicators to judge market characteristics
- Dynamically adjust parameters based on market conditions
- Refined Trading Rules:
- Consider adding time filters
- Implement volume confirmation mechanisms
- Optimize profit/loss ratios
- Strengthened Risk Control:
- Implement dynamic position sizing
- Add maximum drawdown controls
- Design comprehensive money management plans
Summary
This strategy constructs a relatively complete trading system by combining EMA trend following, RSI momentum filtering, and ATR dynamic risk control. Its main feature is the synergistic effect of multiple technical indicators while emphasizing risk management. While there is room for optimization, the overall design philosophy aligns with systematic quantitative trading principles. Traders are advised to conduct thorough parameter optimization and backtesting before live implementation, while making appropriate adjustments based on their risk tolerance and money management requirements.
/*backtest
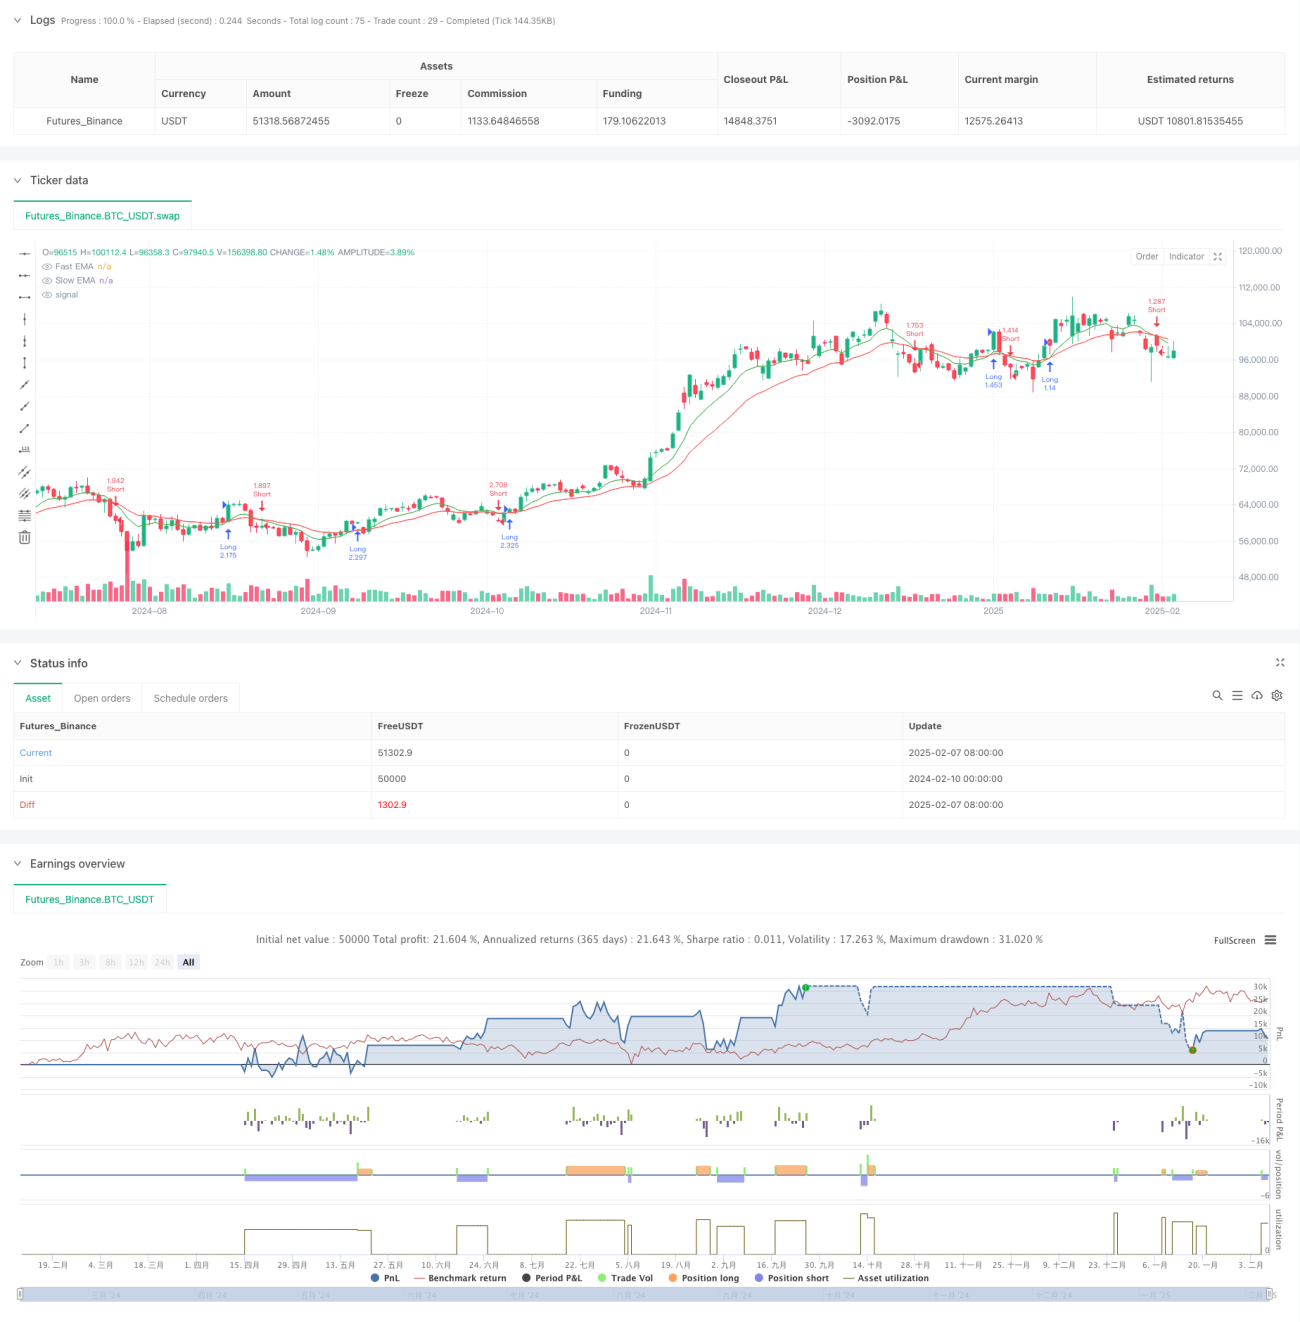
start: 2024-02-10 00:00:00
end: 2025-02-08 08:00:00
period: 1d
basePeriod: 1d
exchanges: [{"eid":"Futures_Binance","currency":"BTC_USDT"}]
*/
//@version=5
strategy("Day Trading EMA/RSI Strategy", overlay=true, default_qty_type=strategy.percent_of_equity, default_qty_value=200)
// Ulazni parametri- 1