
Overview
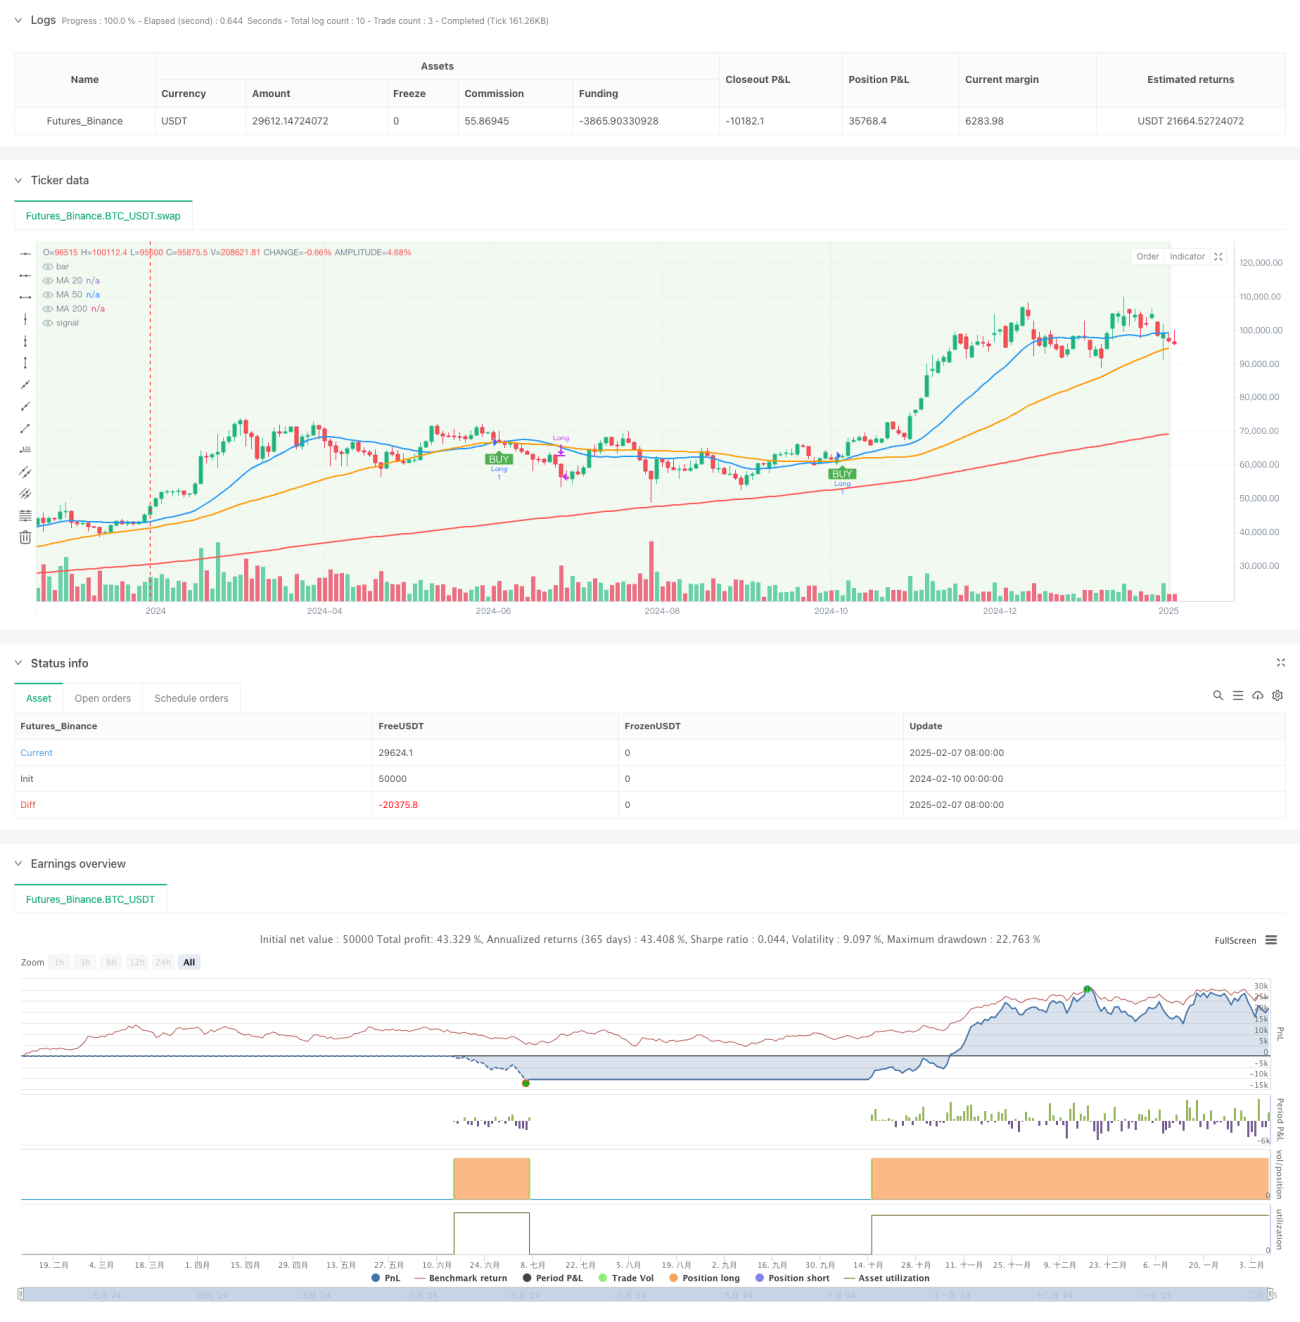
This is a triple moving average trend following strategy based on Oliver Valez's trading methodology. The strategy utilizes 20-period, 50-period, and 200-period moving averages to identify market trends and trading opportunities. The 200-period MA serves as the primary trend filter, while crossovers between the 20-period and 50-period MAs generate specific trading signals. The strategy includes built-in risk management features with stop-loss and take-profit settings.
Strategy Principles
The core logic consists of three key aspects:
- Trend Identification: Uses the 200-period MA as a trend boundary. When price is above the 200 MA, an uptrend is confirmed; when below, a downtrend is confirmed.
- Trading Signals: In uptrends, long entries are triggered when the 20-period MA crosses above the 50-period MA; in downtrends, short entries occur when the 20-period MA crosses below the 50-period MA.
- Risk Control: The strategy implements a default 2% stop-loss and 4% take-profit, with automatic position closure on reverse crossover signals.
Strategy Advantages
- Multiple Confirmation System: The combination of three moving averages provides more reliable trading signals.
- Trend Filtering: The 200 MA trend filter effectively reduces false breakout risks.
- High Flexibility: Supports switching between SMA and EMA, with adjustable parameters for different market characteristics.
- Comprehensive Risk Management: Built-in stop-loss and take-profit mechanisms protect capital.
- Visual Enhancement: Trend status is intuitively displayed through background color changes.
Strategy Risks
- Lag Effect: Moving averages are inherently lagging indicators, potentially causing delayed entries or exits.
- Poor Performance in Ranging Markets: Frequent MA crossovers during consolidation periods may generate false signals.
- Fixed Stop-Loss Risk: Using fixed percentage stops may not suit all market conditions.
- Parameter Sensitivity: Different MA period settings can produce significantly different results.
Optimization Directions
- Incorporate Volume Analysis: Add volume confirmation indicators to improve signal reliability.
- Dynamic Stop-Loss: Consider using ATR or volatility indicators for dynamic stop-loss adjustment.
- Add Trend Strength Filtering: Introduce ADX or other trend strength indicators to filter weak trend environments.
- Optimize Entry Timing: Integrate price patterns and support/resistance levels for more precise entries.
- Include Time Filtering: Set trading time windows to avoid highly volatile periods.
Summary
This is a well-structured trend following strategy with clear logic. The coordination of triple moving averages ensures accurate trend identification while providing definitive trading signals. While the strategy's risk management mechanisms are relatively comprehensive, there is room for optimization. Traders are advised to conduct thorough backtesting before live implementation and adjust parameters according to specific trading instrument characteristics.
- 1