Overview
This strategy is a trend-following trading system based on the Vortex Indicator (VI). It identifies market trend reversals by calculating positive momentum (VI+) and negative momentum (VI-), generating trading signals at key indicator crossovers. The strategy employs Simple Moving Average (SMA) smoothing to reduce noise and enhance signal reliability.
Strategy Principles
The core mechanism relies on comparing the relative strength of VI+ and VI- to determine trend direction. The calculation process includes: 1. Computing positive momentum (VM+) and negative momentum (VM-) 2. Normalizing using True Range 3. Applying SMA smoothing to obtain final VI+ and VI- 4. Generating long signals when VI+ crosses above VI-, and short signals when VI+ crosses below VI-
Strategy Advantages
- Clear Signals: Crossover signals are distinctly visible, facilitating trading decisions
- Trend Adaptation: Effectively captures medium to long-term trend reversals
- Noise Filtration: SMA smoothing effectively reduces false signals
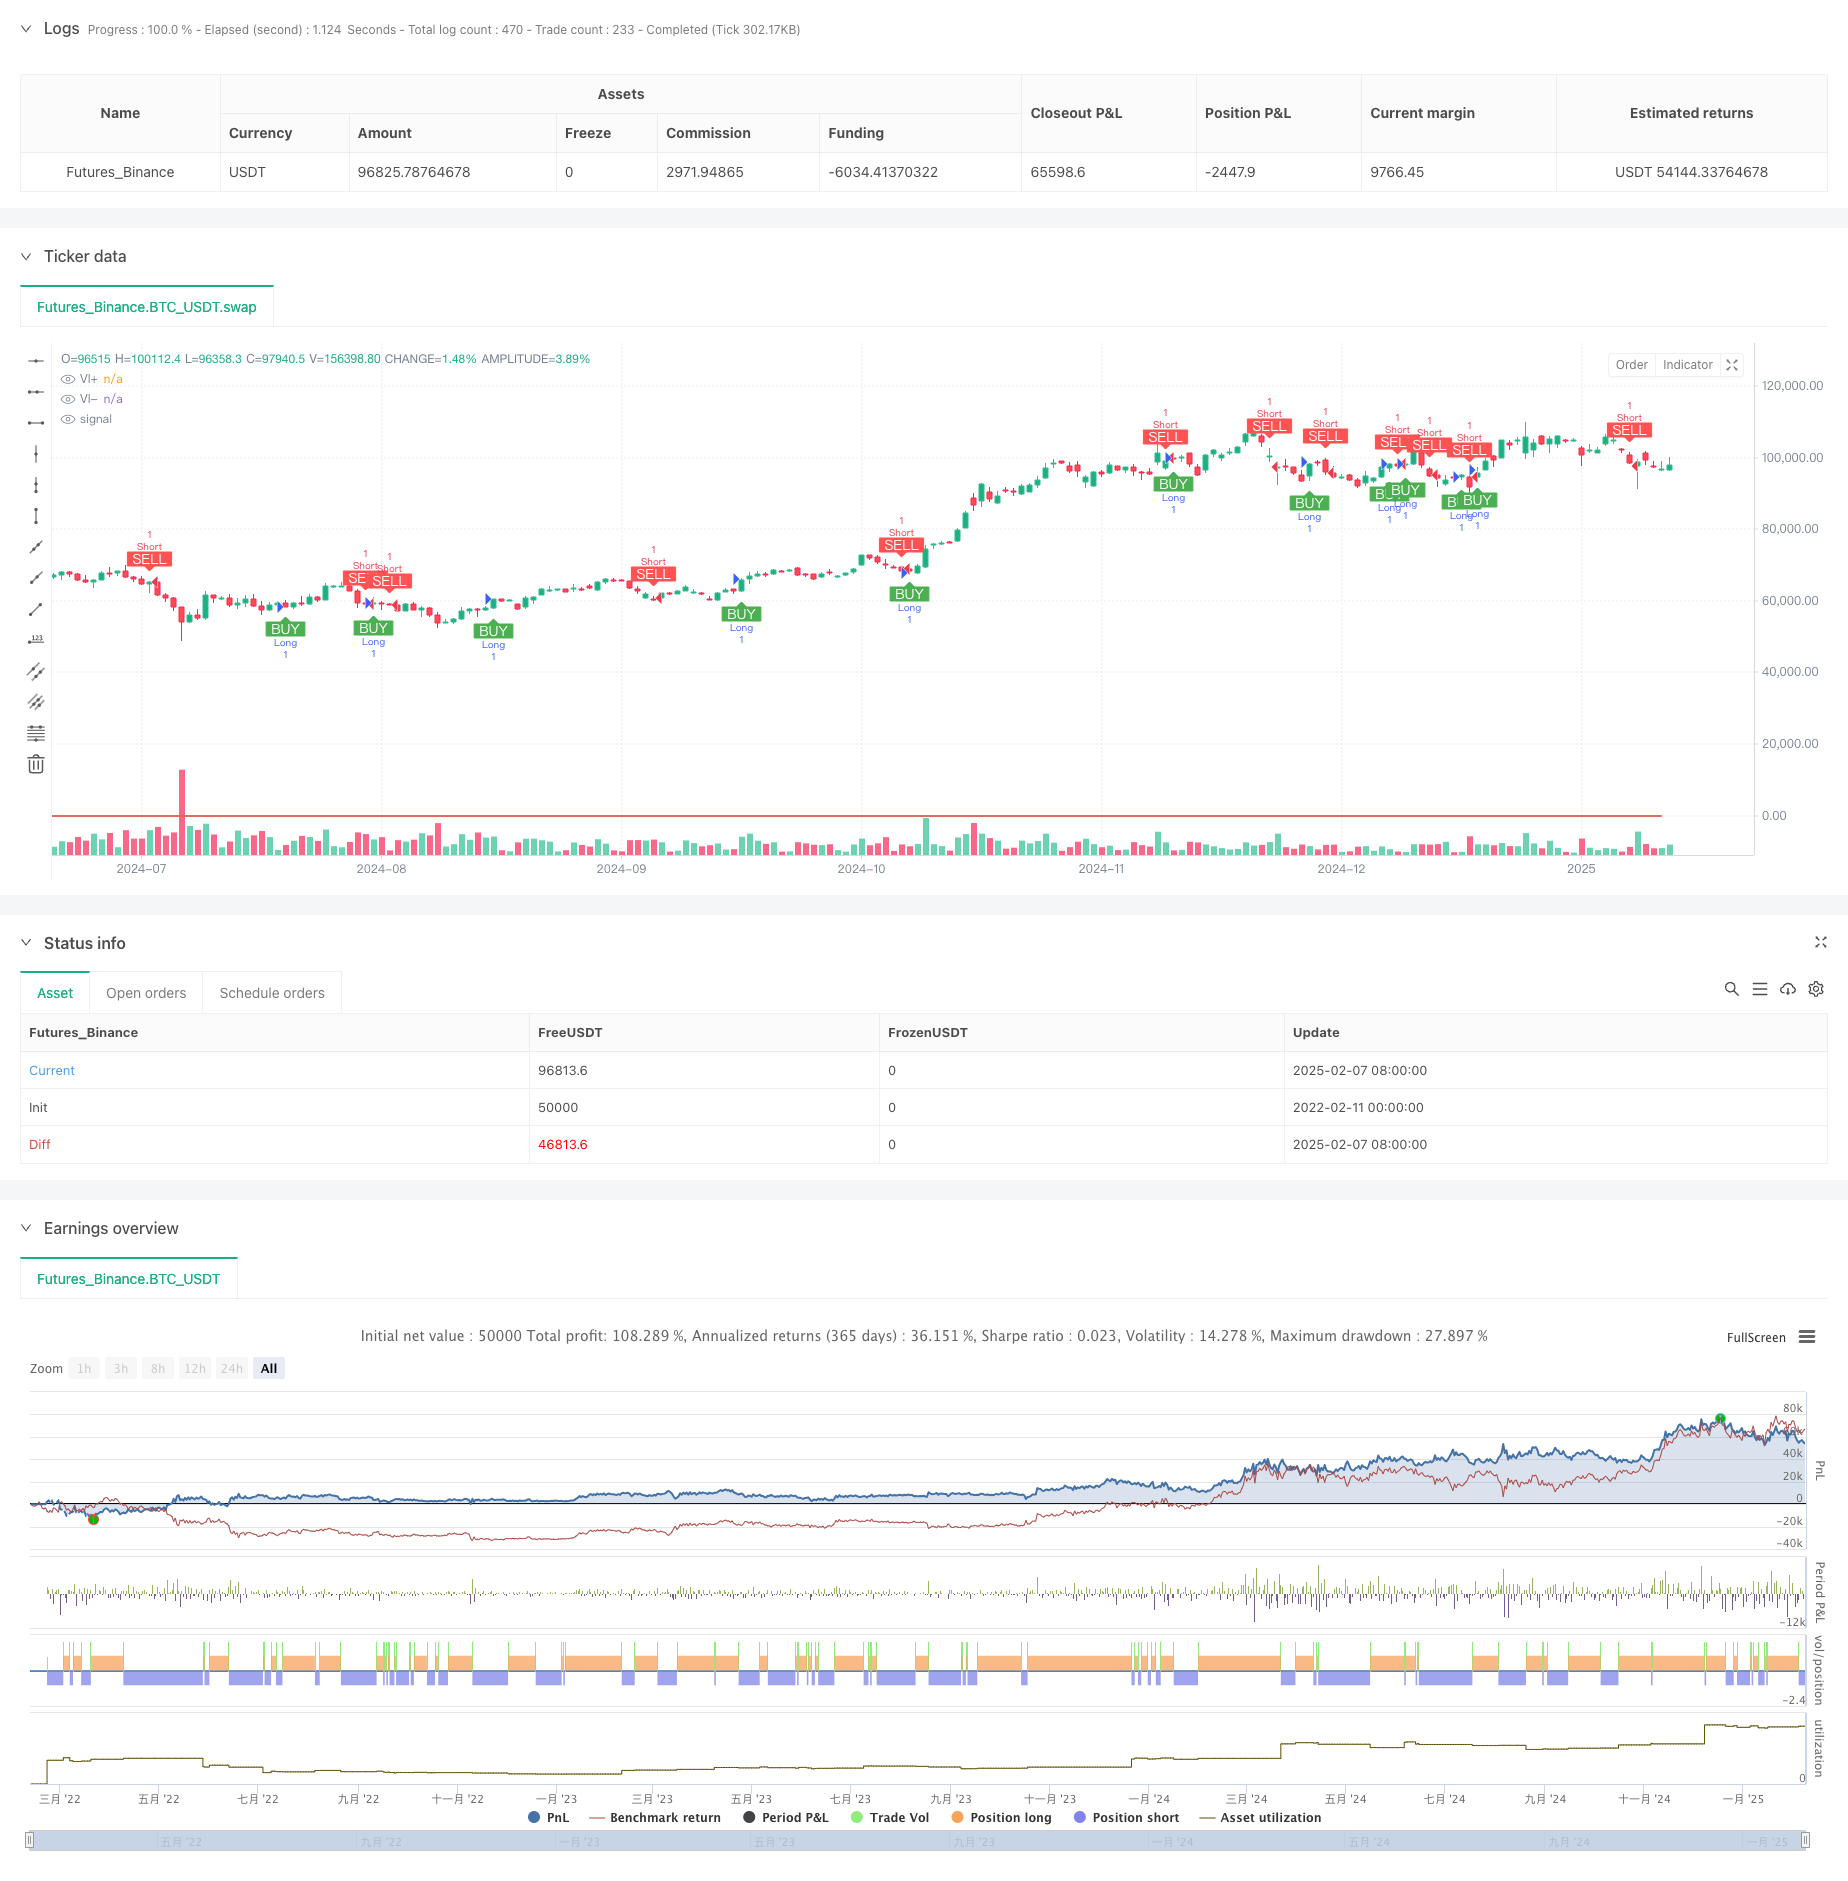
- Strong Visualization: Intuitive buy/sell signal markers on charts
- Parameter Flexibility: Adjustable periods for different market characteristics
Strategy Risks
- Lag Effect: Signal delay due to moving average processing
- Poor Performance in Ranging Markets: May generate frequent false signals during consolidation
- Drawdown Risk: Potential significant drawdowns during trend reversals
- Parameter Sensitivity: Strategy performance heavily depends on parameter settings
Optimization Directions
- Add Trend Strength Filter: Incorporate ADX or similar indicators to filter weak trends
- Implement Dynamic Stop-Loss: Design ATR-based dynamic stop-loss levels
- Optimize Position Sizing: Adjust position size based on VI divergence magnitude
- Multi-Timeframe Analysis: Incorporate higher timeframe trend analysis
Summary
This strategy provides a reliable framework for trend-following trading through innovative application of the Vortex Indicator. While it has inherent lag, appropriate parameter optimization and risk management measures can create a robust trading system. Traders should conduct thorough backtesting before live implementation and optimize based on specific market characteristics.
/*backtest
start: 2022-02-11 00:00:00
end: 2025-02-08 08:00:00
period: 1d
basePeriod: 1d
exchanges: [{"eid":"Futures_Binance","currency":"BTC_USDT"}]
*/

//@version=5
strategy("Vortex Strategy with Signals", shorttitle="VI_Strat", overlay=true)

// Užívateľský vstup
length = input.int(14, title="Period", minval=1)

//------------------------------------
// 1) Výpočet Vortexu
//------------------------------------
vmPlus     = math.abs(high - low[1])
vmMinus    = math.abs(low - high[1])
trueRange  = math.max(math.max(high - low, math.abs(high - close[1])), math.abs(low - close[1]))

// SMA vyhladzovanie
smoothedVMPlus     = ta.sma(vmPlus,     length)
smoothedVMMinus    = ta.sma(vmMinus,    length)
smoothedTrueRange  = ta.sma(trueRange,  length)

// Vortex Indikátory
viPlus  = smoothedVMPlus  / smoothedTrueRange
viMinus = smoothedVMMinus / smoothedTrueRange

//------------------------------------
// 2) Plot indikátora
//------------------------------------
plot(viPlus,  color=color.green, title="VI+")
plot(viMinus, color=color.red,   title="VI-")

//------------------------------------
// 3) Definícia signálov
//------------------------------------
bullSignal = ta.crossover(viPlus, viMinus)    // VI+ pretína VI- smerom nahor
bearSignal = ta.crossunder(viPlus, viMinus)   // VI+ pretína VI- smerom nadol

//------------------------------------
// 4) Vizualizácia signálov na grafe
//------------------------------------
plotshape(bullSignal,
     title="Bull Signal",
     style=shape.labelup,
     location=location.belowbar,
     color=color.green,
     text="BUY",
     textcolor=color.white,
     size=size.small)

plotshape(bearSignal,
     title="Bear Signal",
     style=shape.labeldown,
     location=location.abovebar,
     color=color.red,
     text="SELL",
     textcolor=color.white,
     size=size.small)

//------------------------------------
// 5) STRATEGY LOGIC
//------------------------------------
if bullSignal
    strategy.entry("Long", strategy.long)

if bearSignal
    strategy.entry("Short", strategy.short)