Dual Moving Average Crossover with Stochastic RSI Overbought/Oversold Enhanced Trading Strategy

Overview
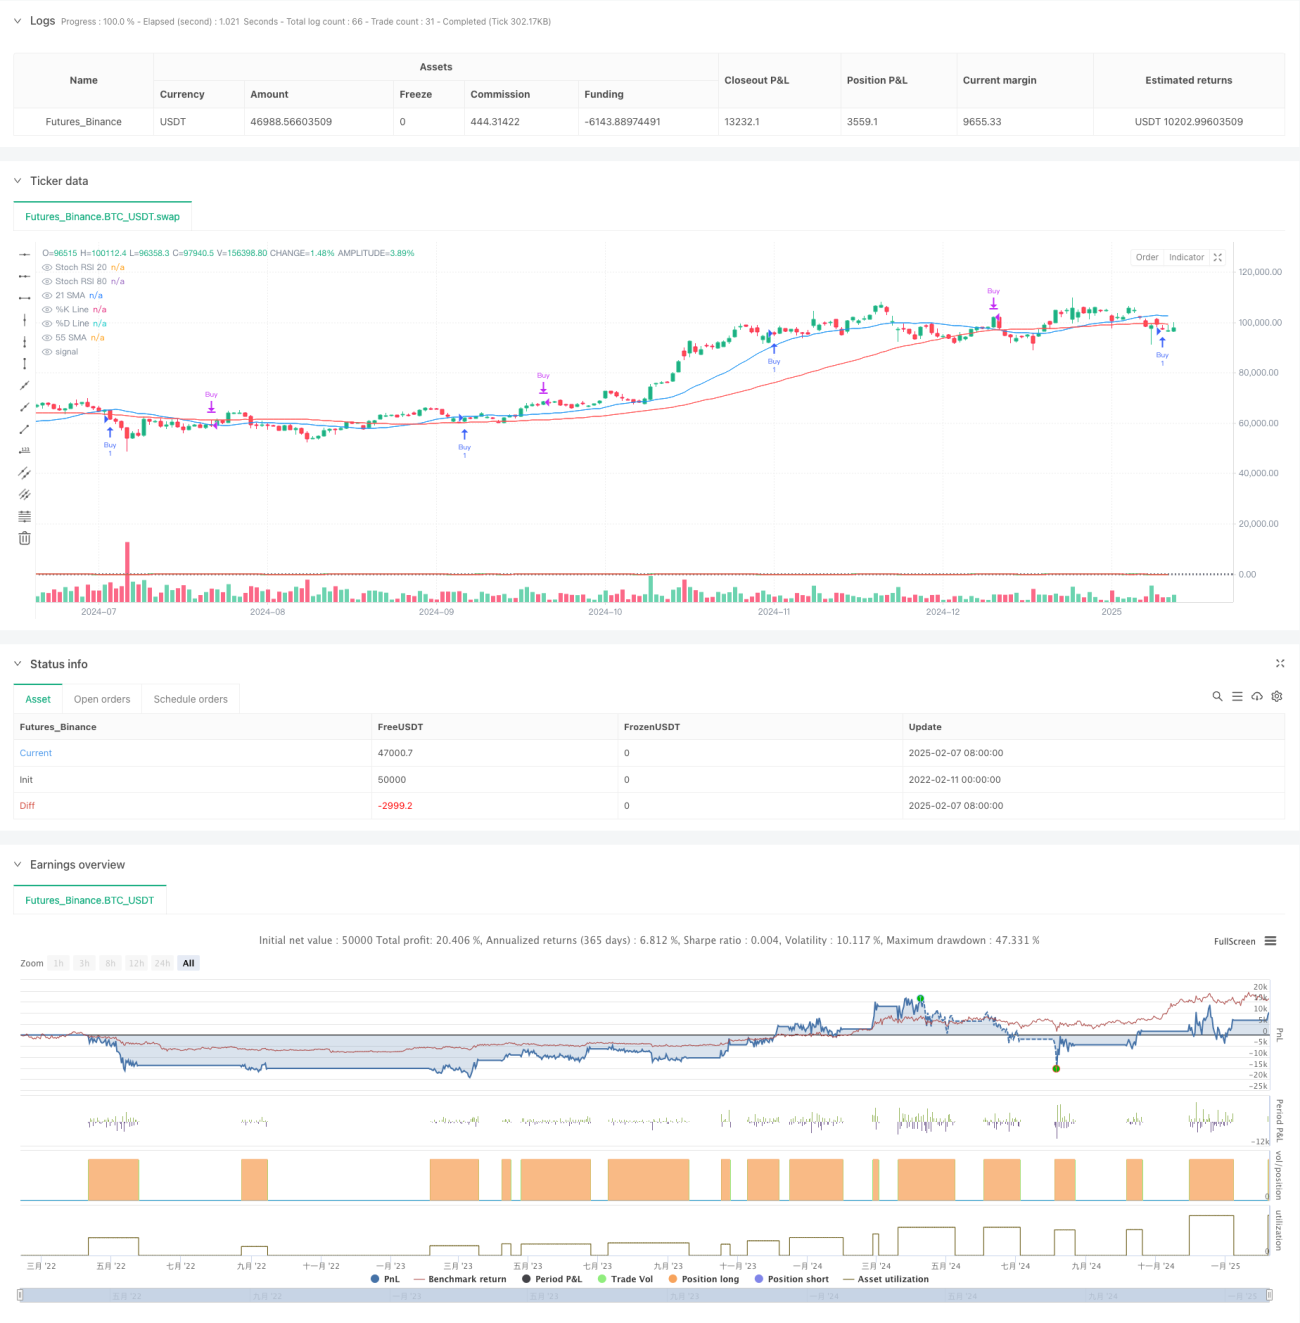
This strategy is a trend-following trading system that combines dual moving averages with the Stochastic RSI indicator. It uses 21-period and 55-period Simple Moving Averages to determine market trends, while utilizing Stochastic RSI's overbought/oversold zones to optimize entry and exit points, enhancing trend trading effectiveness.
Strategy Principles
The strategy employs the following core logic:
- Trend Confirmation: Uses 21-period SMA and 55-period SMA, confirming an uptrend when the shorter MA is above the longer MA.
- Entry Signal: After trend confirmation, waits for the Stochastic RSI K-line to form a golden cross with the D-line in the oversold zone below 20.
- Exit Signal: Closes positions when the Stochastic RSI K-line forms a death cross with the D-line in the overbought zone above 80.
- Signal Filtering: Effectively reduces false signals by combining trend and momentum indicators.
Strategy Advantages
- Multiple Confirmation Mechanism: Enhances trading reliability through dual confirmation of trend and momentum.
- Optimized Risk Control: Uses overbought/oversold zones to select optimal entry points in trend direction.
- Strong Adaptability: Strategy parameters can be adjusted for different market characteristics.
- Clear Signals: Entry and exit conditions are well-defined and easy to execute.
- High Systematization: Strategy logic is fully systematic, reducing subjective judgment.
Strategy Risks
- Choppy Market Risk: May generate frequent trades in sideways markets.
- Lag Risk: Moving averages have inherent lag, potentially missing optimal entry points.
- False Breakout Risk: Stochastic RSI may generate false signals in ranging markets.
- Parameter Sensitivity: Different parameter combinations may lead to significant performance variations.
Strategy Optimization Directions
- Add Volatility Filter: Incorporate ATR indicator to reduce trading frequency during low volatility periods.
- Optimize Exit Mechanism: Consider adding trailing stops or profit targets.
- Market Environment Classification: Dynamically adjust parameters based on different market conditions.
- Add Volume Confirmation: Include volume indicators to verify signal validity.
- Introduce Trend Strength Indicator: Such as ADX, to filter weak trend environments.
Summary
This strategy constructs a complete trend-following trading system by combining classic technical indicators. While maintaining simplicity and intuitiveness, it enhances reliability through multiple signal confirmations. With proper parameter optimization and risk management, the strategy demonstrates good practical value. Traders are advised to conduct thorough backtesting before live implementation and adjust parameters according to specific market characteristics.
- 1