Overview
This strategy is an intelligent trading system based on MACD (Moving Average Convergence Divergence) crossover signals. It generates buy and sell signals by analyzing the crossovers between the MACD line and signal line, with visual representation on the chart. The system integrates real-time alerts to notify traders of potential trading opportunities.
Strategy Principles
The strategy’s core utilizes the MACD indicator to capture market momentum changes. The implementation includes these key steps: 1. Calculate MACD line using fast EMA (12 periods) and slow EMA (26 periods) 2. Use 9-period EMA as signal line 3. Generate buy signal when MACD line crosses above signal line 4. Generate sell signal when MACD line crosses below signal line The system visually displays MACD histogram, crossover signals on the chart, and sends trading alerts at crucial moments.
Strategy Advantages
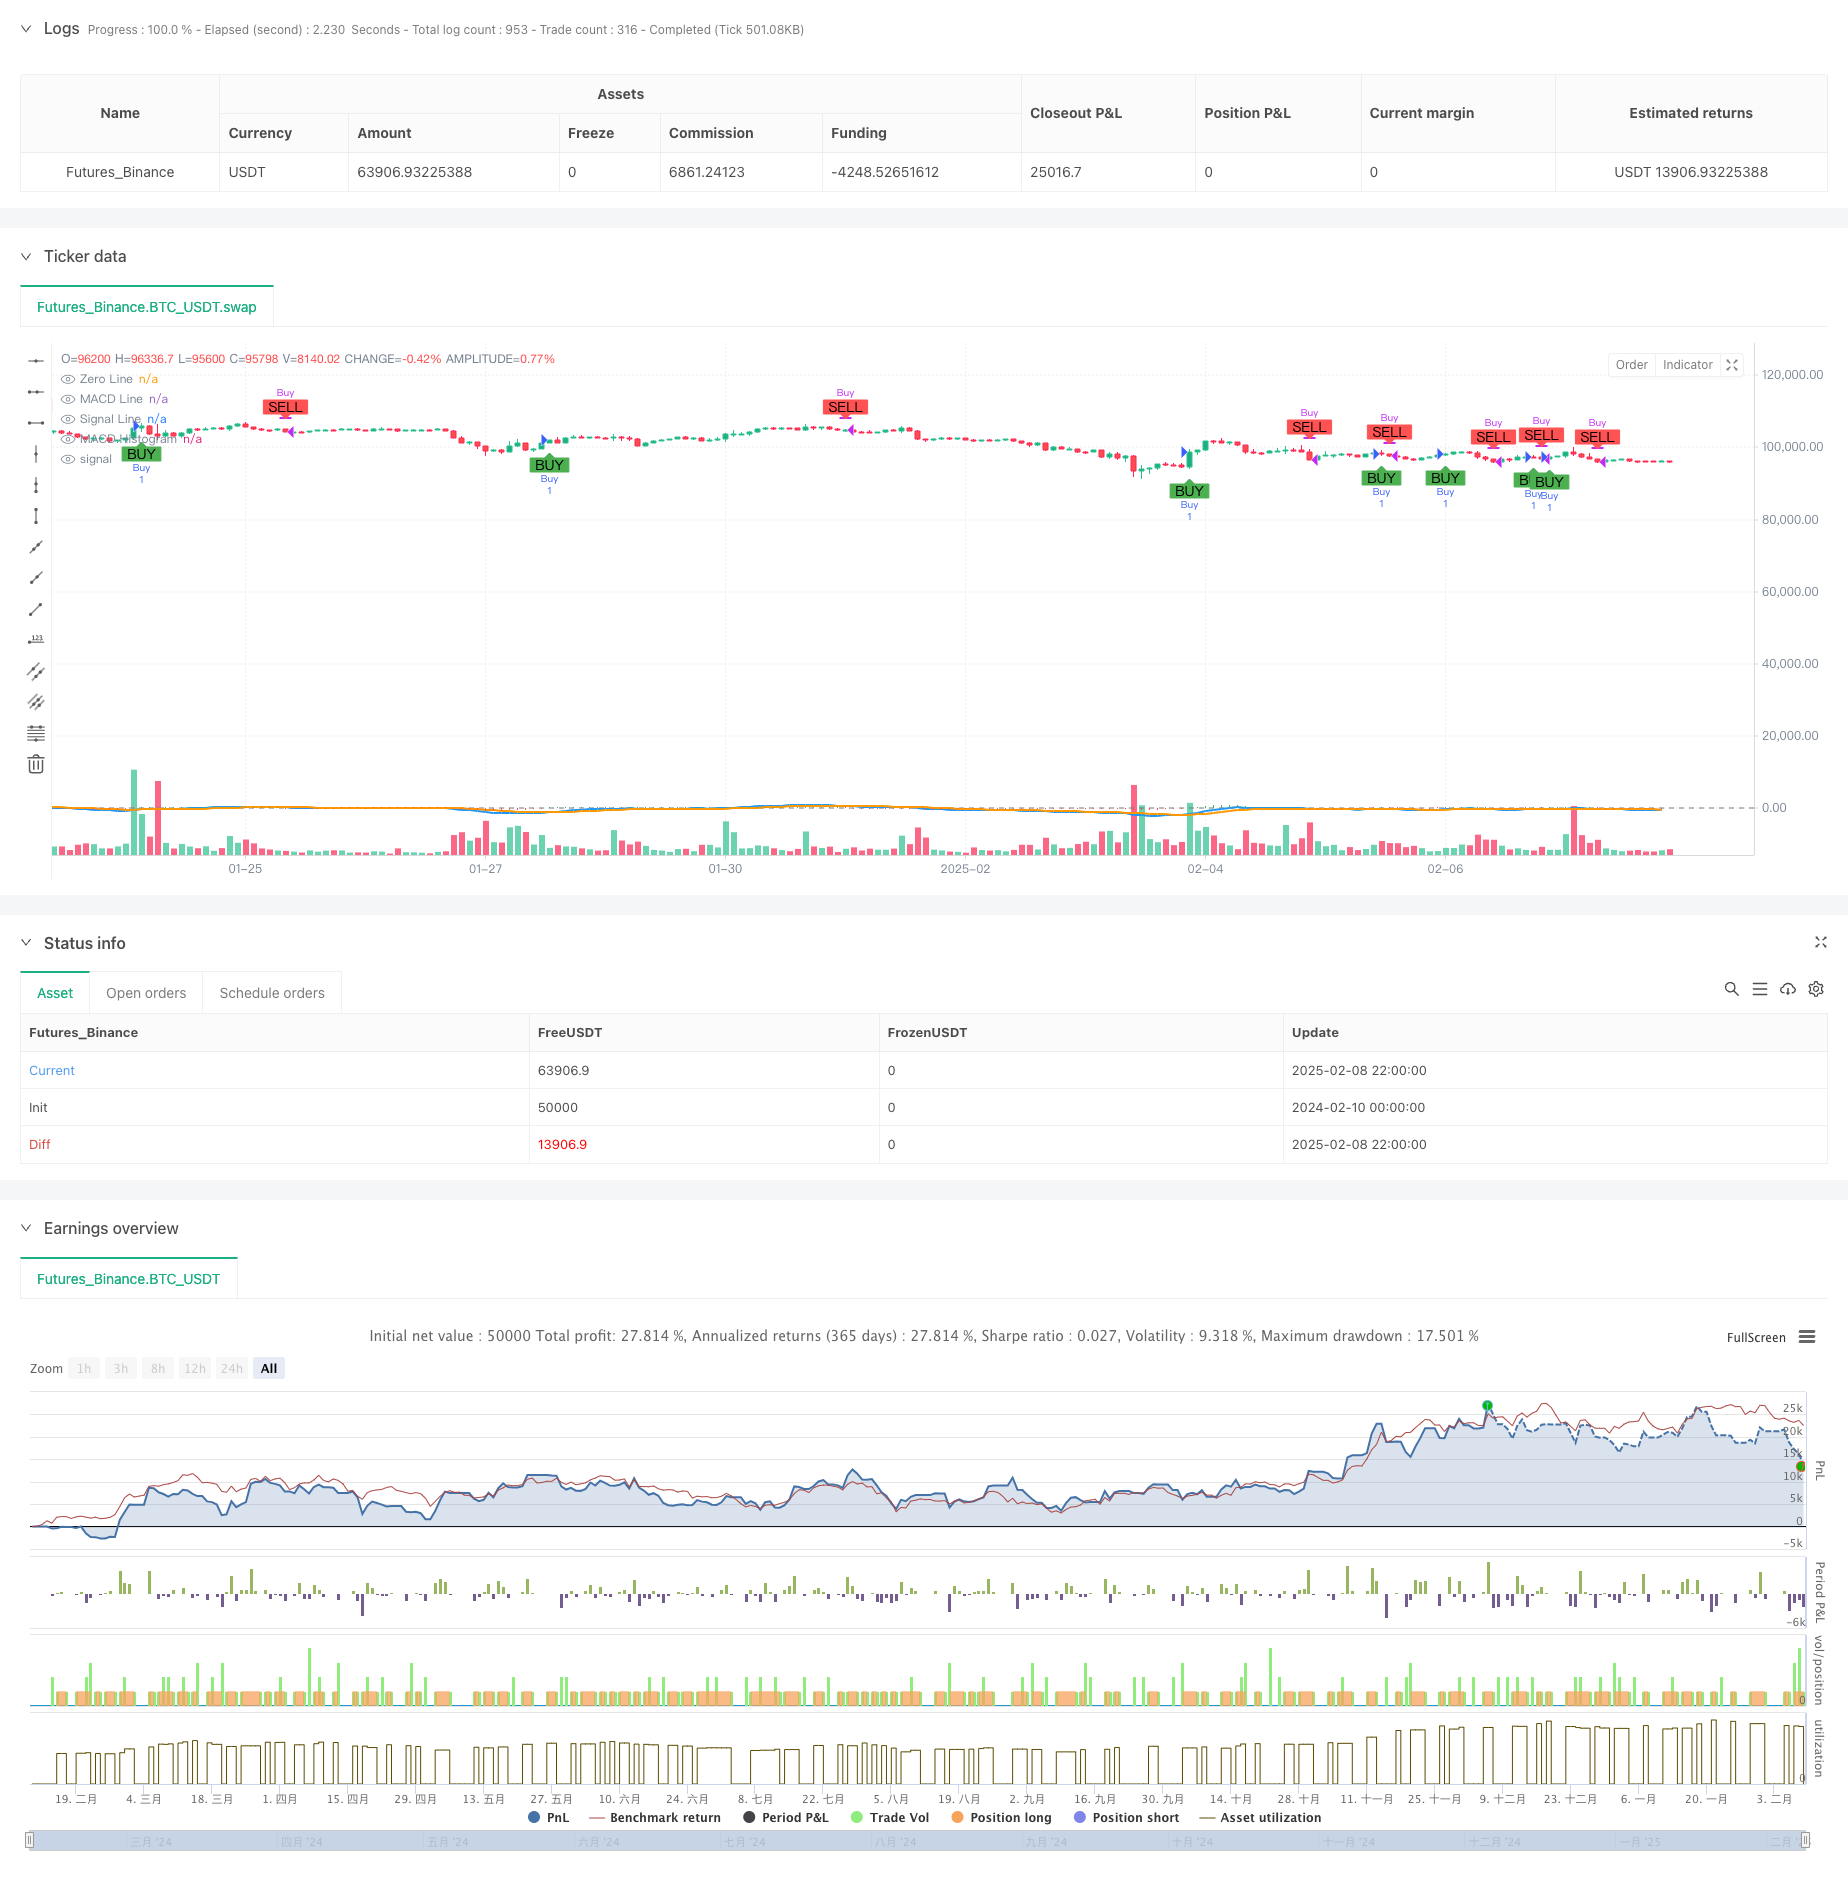
- Visual Clarity: Displays buy/sell signals directly on price chart for quick decision making
- Clear Signals: Generates trading signals based on definitive crossover rules, reducing subjective judgment
- Real-time Alerts: Integrated alert system ensures no important trading opportunities are missed
- Adjustable Parameters: Allows adjustment of fast and slow line periods to adapt to different market conditions
- Systematic Trading: Automatic execution of entry and exit operations, reducing emotional interference
Strategy Risks
- Lag Risk: MACD is a lagging indicator, may generate delayed signals in volatile markets
- Consolidation Risk: Prone to false signals in ranging markets
- Money Management Risk: Lack of stop-loss mechanism may lead to significant losses in extreme conditions
- Parameter Dependency: Different market environments may require different parameter settings
Strategy Optimization Directions
- Add Stop-loss Mechanism: Implement fixed or trailing stop-loss functionality
- Introduce Trend Filters: Combine with other trend indicators to filter signals in ranging markets
- Optimize Parameter Adaptation: Develop automatic parameter optimization to adapt to market changes
- Enhance Position Management: Dynamically adjust position size based on signal strength
- Add Drawdown Control: Set maximum drawdown limits to improve risk control
Summary
This is a well-structured MACD crossover strategy system with clear logic. Through visual display and automated execution, it provides traders with an objective trading tool. While there are certain lag risks, the suggested optimization directions can further enhance the strategy’s stability and reliability. The strategy is particularly suitable for trending markets and is an excellent choice for investors looking to implement systematic trading.
/*backtest
start: 2024-02-10 00:00:00
end: 2025-02-09 00:00:00
period: 2h
basePeriod: 2h
exchanges: [{"eid":"Futures_Binance","currency":"BTC_USDT"}]
*/

//@version=6
strategy("ETH/USD MACD Crossover", overlay=true)

// MACD settings
fastLength = input(12, title="Fast EMA Length")
slowLength = input(26, title="Slow EMA Length")
signalLength = input(9, title="Signal Line Length")

// MACD calculation
[macdLine, signalLine, _] = ta.macd(close, fastLength, slowLength, signalLength)

// Plot MACD and Signal Line
plot(macdLine, color=color.blue, title="MACD Line", linewidth=2)
plot(signalLine, color=color.orange, title="Signal Line", linewidth=2)
hline(0, "Zero Line", color=color.gray)

// MACD Histogram
macdHistogram = macdLine - signalLine
plot(macdHistogram, color=macdHistogram >= 0 ? color.green : color.red, style=plot.style_histogram, title="MACD Histogram")

// Buy and Sell Conditions
buyCondition = ta.crossover(macdLine, signalLine)  // MACD crosses above Signal Line
sellCondition = ta.crossunder(macdLine, signalLine)  // MACD crosses below Signal Line

// Plot buy/sell signals on the chart
plotshape(series=buyCondition, title="Buy Signal", location=location.belowbar, color=color.green, style=shape.labelup, text="BUY")
plotshape(series=sellCondition, title="Sell Signal", location=location.abovebar, color=color.red, style=shape.labeldown, text="SELL")

// Alerts for buy/sell conditions
if (buyCondition)
    alert("MACD Crossover: BUY signal for ETH/USD", alert.freq_once_per_bar)

if (sellCondition)
    alert("MACD Crossover: SELL signal for ETH/USD", alert.freq_once_per_bar)

// Strategy entry/exit
if (buyCondition)
    strategy.entry("Buy", strategy.long)
if (sellCondition)
    strategy.close("Buy")