
Overview
This strategy is an innovative trend following trading system that employs dual-layer exponential smoothing technology to identify market trends. The system processes price data through a special exponential smoothing technique to generate two trend lines for capturing short-term and long-term market movements. It integrates a complete risk management module, including profit-taking and stop-loss settings, along with flexible position management capabilities.
Strategy Principle
The core of the strategy lies in its unique dual-layer exponential smoothing algorithm. First, the system applies weighted processing to the closing price, calculated as (High+Low+2*Close)/4, which helps reduce market noise. Then, through a custom exponential smoothing function, it calculates 9-period and 30-period smoothing curves. Trading signals are generated when the short-term curve crosses the long-term curve. An upward cross generates a long signal, while a downward cross generates a short signal. The system also includes a percentage-based position management system, defaulting to 100% of account equity for trading.
Strategy Advantages
- Clear signal generation mechanism based on classic trend-following principles, easy to understand and execute.
- Dual-layer exponential smoothing technology effectively filters market noise and improves signal quality.
- Integrated complete risk management system, including profit-taking, stop-loss, and position management.
- System can adapt to different market environments and is suitable for various trading instruments.
- Provides clear visual indicators for traders to quickly judge market direction.
Strategy Risks
- May generate frequent false signals in ranging markets, leading to consecutive stops.
- Default 100% equity usage for trading may carry excessive leverage risk.
- Fixed-point profit-taking and stop-loss settings may not suit all market environments.
- System may experience slippage in volatile markets, affecting execution quality.
- Historical backtest results cannot guarantee future performance.
Strategy Optimization Directions
- Introduce volatility indicators (like ATR) to dynamically adjust profit-taking and stop-loss levels.
- Add trend strength filters to reduce trading frequency in weak trend environments.
- Incorporate market environment recognition module to automatically adjust strategy parameters in ranging markets.
- Develop dynamic position management system to automatically adjust trading size based on market conditions.
- Integrate fundamental analysis module to improve trading decision accuracy.
Summary
This is a well-designed trend following system with clear logic. Through dual-layer exponential smoothing technology and a complete risk management system, the strategy can perform well in trending markets. However, users need to adjust position sizes according to their risk tolerance and are advised to conduct thorough backtesting before live trading. Through the suggested optimization directions, this strategy has room for further improvement.
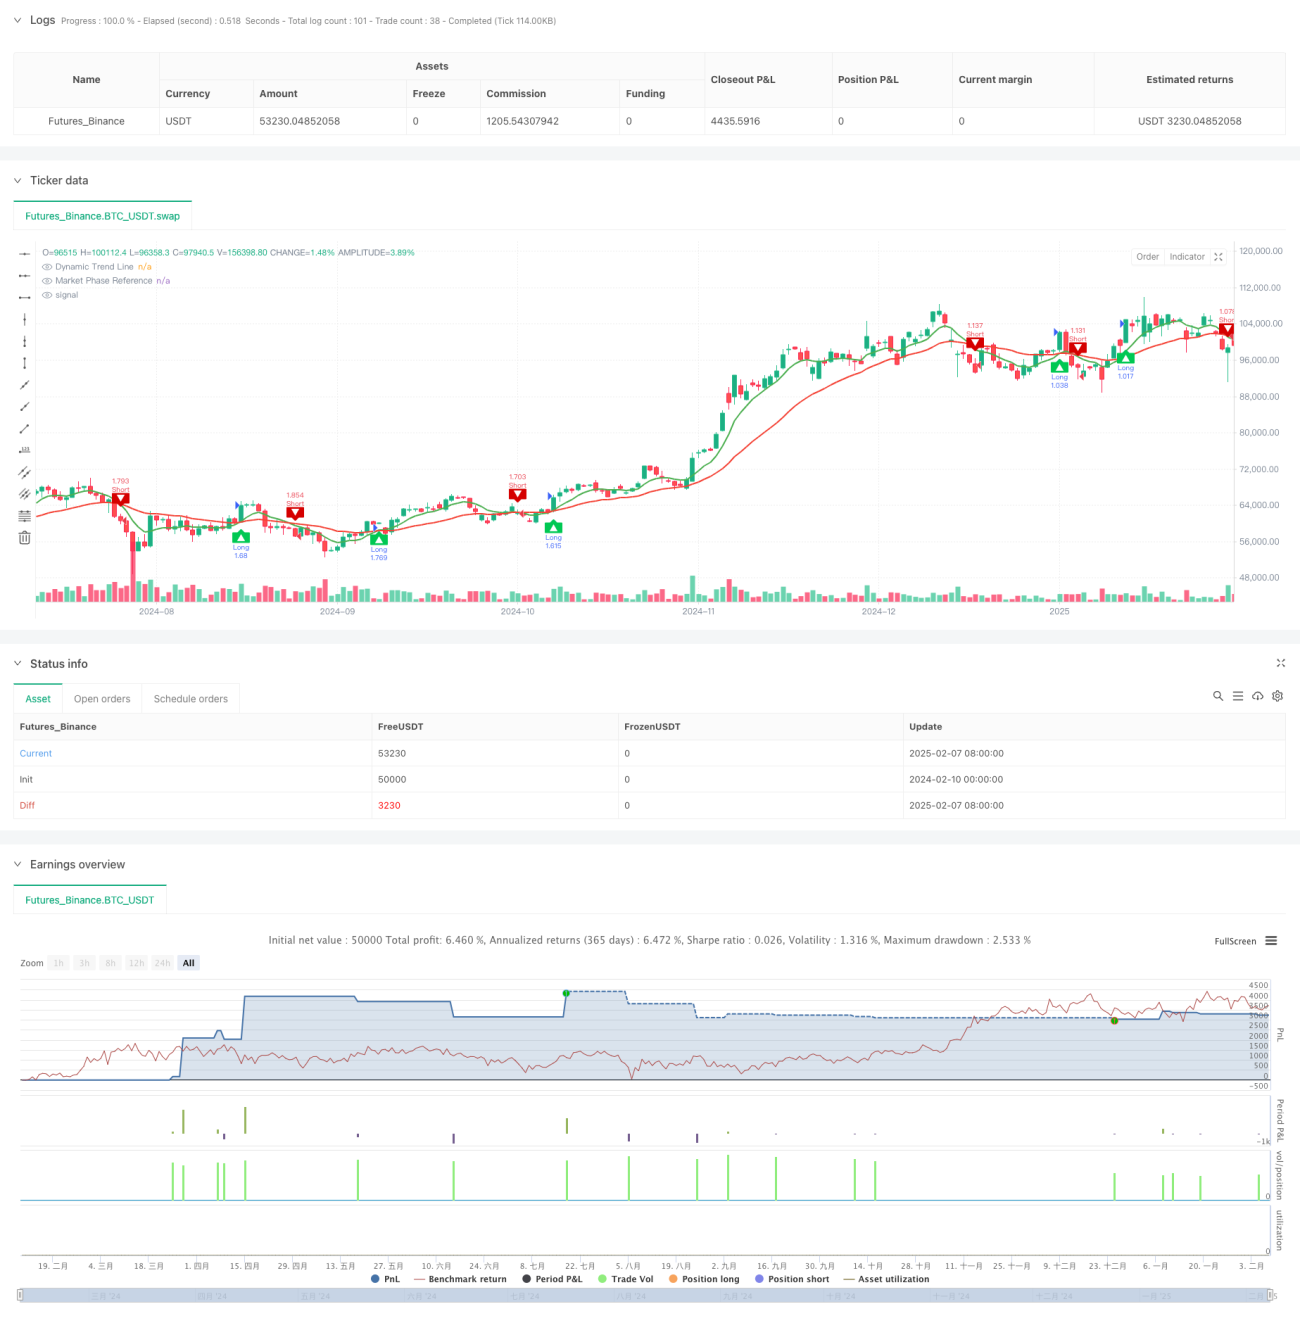
/*backtest
start: 2024-02-10 00:00:00
end: 2025-02-08 08:00:00
period: 1d
basePeriod: 1d
exchanges: [{"eid":"Futures_Binance","currency":"BTC_USDT"}]
*/

//@version=5
strategy("Dynamic Trend Navigator AI [CodingView]", overlay=true, initial_capital=100000, default_qty_type=strategy.percent_of_equity , default_qty_value=200 )
- 1