Overview
This strategy is a trend-following trading system that combines Moving Averages (EMA), momentum indicator (MACD), and overbought/oversold indicator (RSI) for signal generation and risk control. The strategy employs a dynamic take-profit mechanism, utilizing multiple technical indicators to assess market conditions and effectively capture trends. It also implements a fixed stop-loss for risk control, creating a balanced and robust trading system.
Strategy Principles
The core logic of the strategy is based on the following aspects: 1. Trend Identification: Uses 50-period and 200-period EMA system to determine market trend, with bullish trend confirmed when short-term EMA is above long-term EMA. 2. Entry Signals: Combines trend confirmation with MACD golden cross (12,26,9) and RSI(14) not in overbought territory (<70) as long entry conditions. 3. Dynamic Take-Profit: Monitors multiple market state indicators for exit timing: - Trend Reversal: Short-term EMA crosses below long-term EMA or price drops below short-term EMA - MACD Death Cross: MACD line crosses below signal line - RSI Overbought Pullback: RSI exceeds 70 and starts declining 4. Risk Control: Implements fixed stop-loss at 1.5% below entry price.
Strategy Advantages
- Multi-dimensional Signal Confirmation: Combines trend, momentum, and overbought/oversold indicators to enhance signal reliability.
- Flexible Take-Profit Mechanism: Dynamic take-profit avoids premature exits associated with fixed take-profit levels, better capturing trending markets.
- Clear Risk Control: Fixed stop-loss percentage ensures controlled risk for each trade.
- Clear Strategy Logic: Each indicator’s role is well-defined, facilitating understanding and optimization.
- High Adaptability: Core logic can be adapted to different trading instruments and timeframes through parameter adjustment.
Strategy Risks
- Choppy Market Risk: Moving average system may generate excessive false signals in ranging markets.
- Lag Risk: Technical indicators have inherent lag, potentially missing optimal entry/exit points in fast-moving markets.
- Parameter Sensitivity: Multiple indicator parameters affect strategy performance, requiring thorough testing.
- Market Environment Dependency: Strategy performs better in trending markets but may underperform in other market conditions.
Strategy Optimization Directions
- Incorporate Volume-Price Indicators: Consider adding volume and money flow indicators to enhance signal reliability.
- Dynamic Parameter Optimization: Dynamically adjust indicator parameters based on market volatility to improve adaptability.
- Enhance Take-Profit Mechanism: Implement multi-level take-profit with different exit conditions at various price levels.
- Add Market Environment Filters: Include volatility and trend strength indicators to assess strategy suitability.
- Optimize Stop-Loss Mechanism: Consider implementing trailing stops or ATR-based dynamic stops for more flexible risk control.
Summary
The strategy combines multiple technical indicators to create a trading system that balances trend following with risk control. The dynamic take-profit mechanism demonstrates deep market understanding, while clear stop-loss settings ensure controlled risk. The strategy framework offers good extensibility, with potential for improved trading performance through further optimization and refinement.
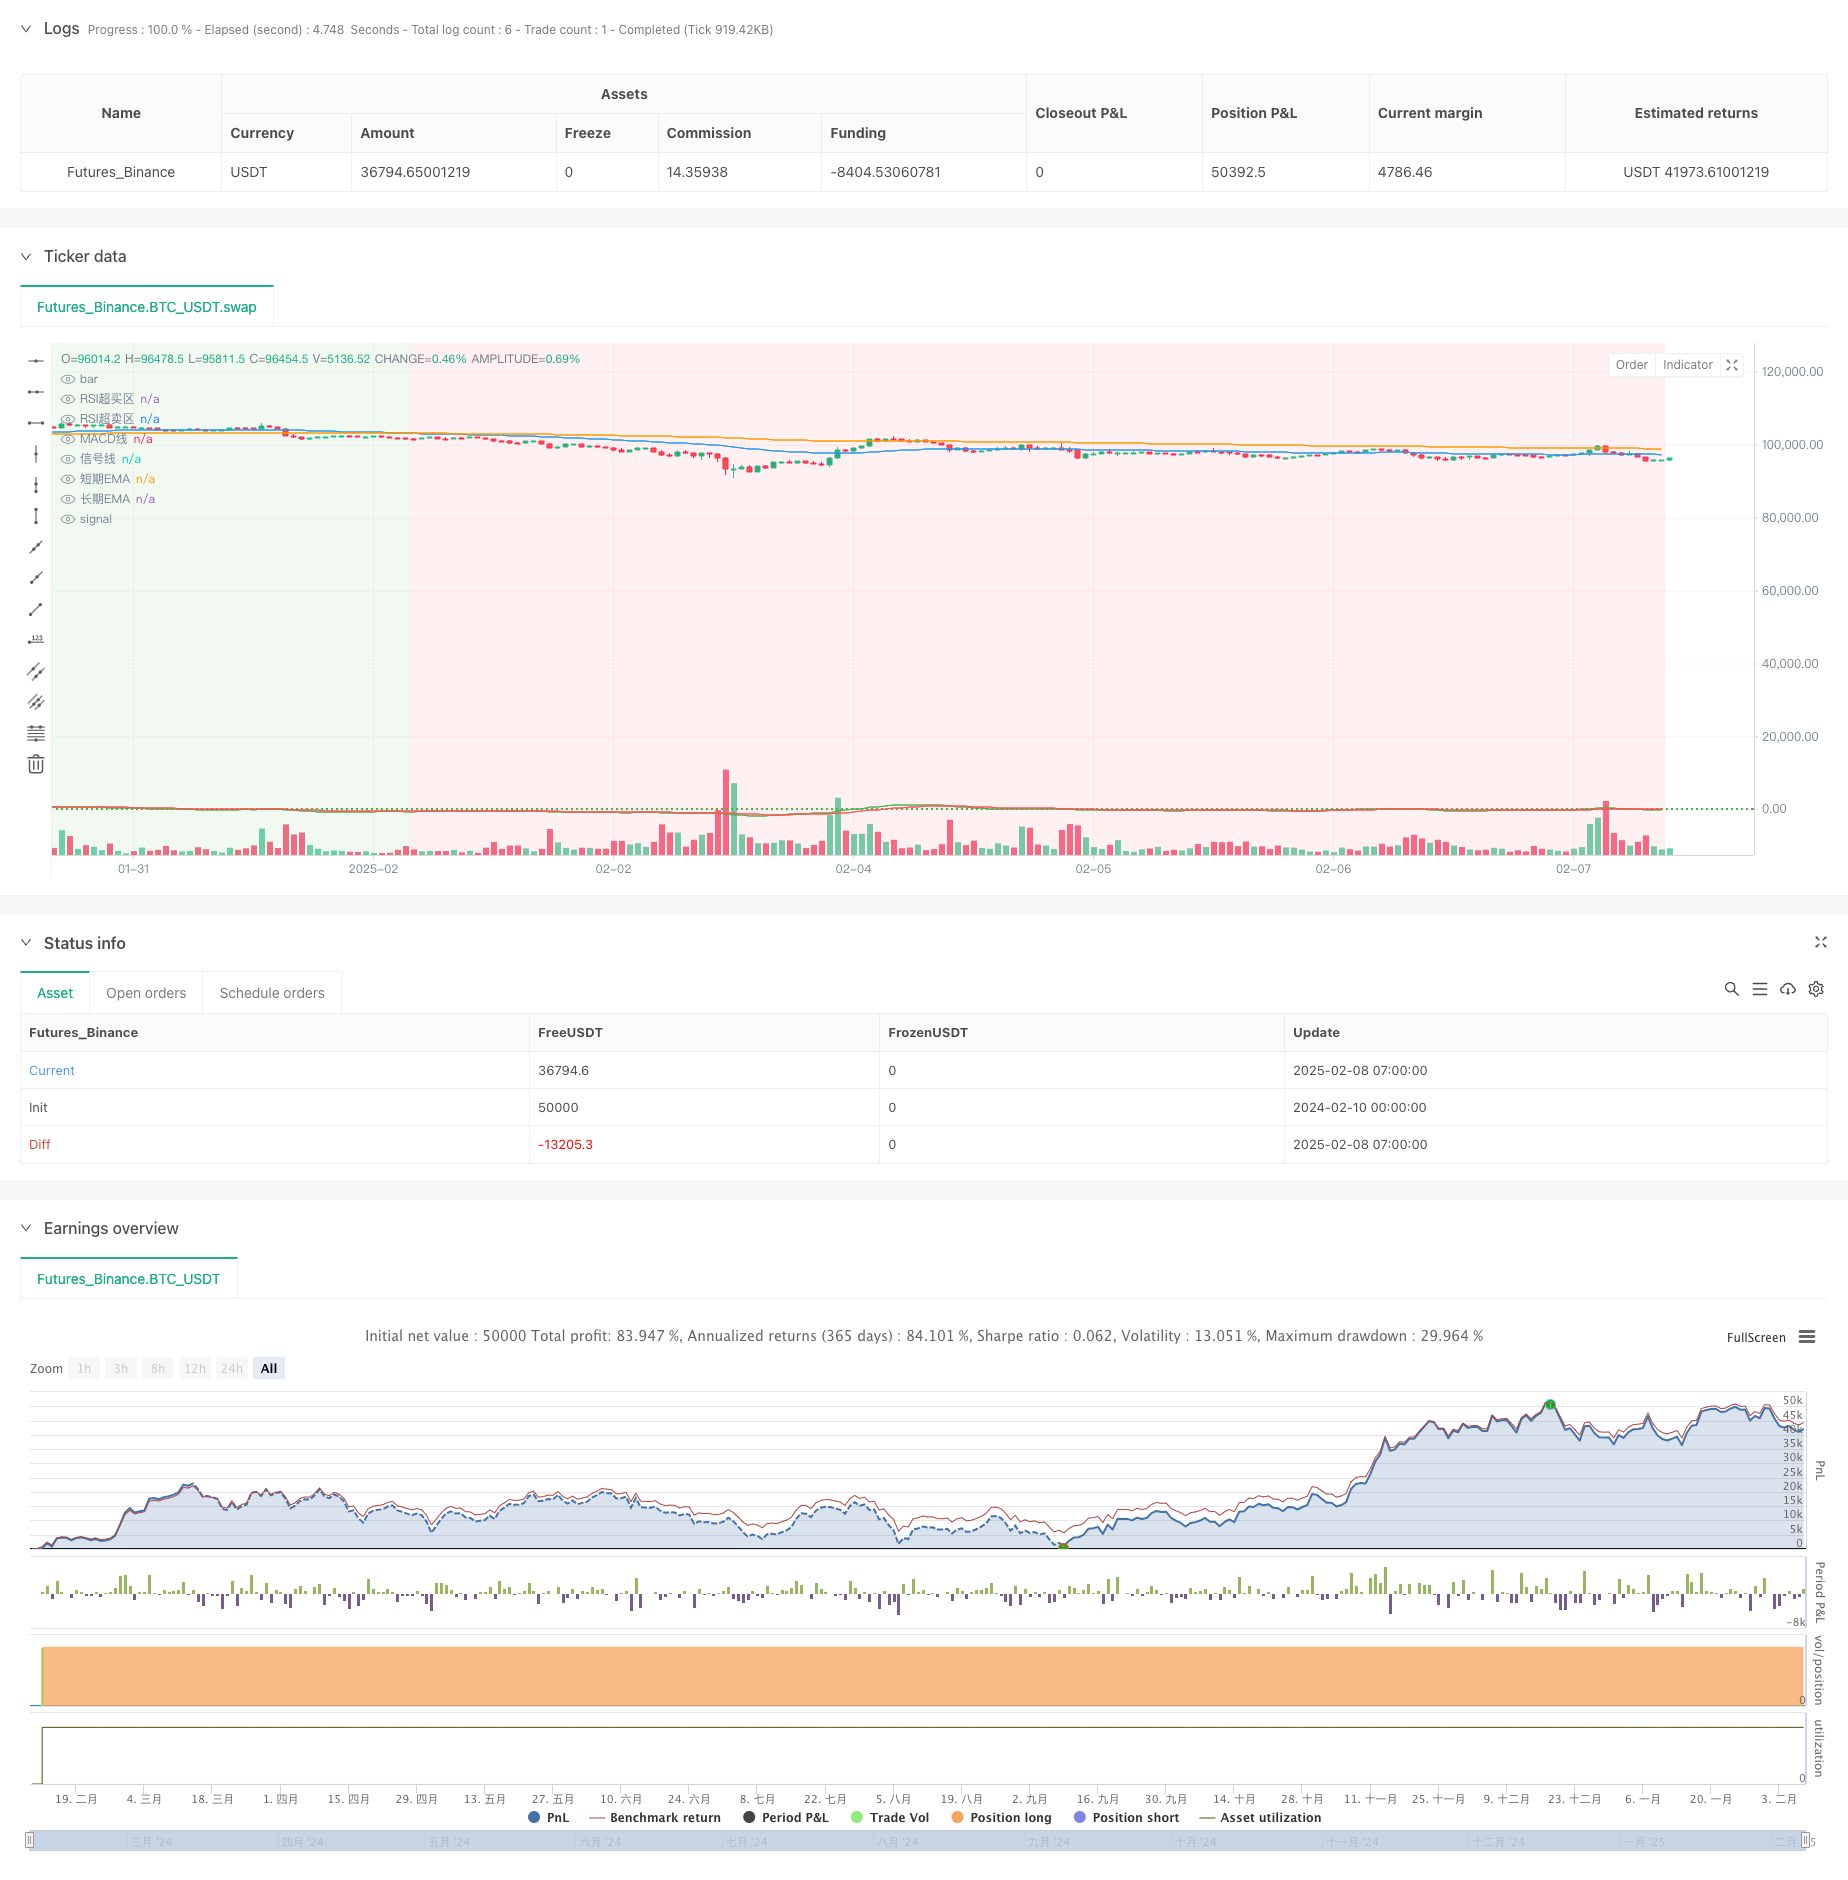
/*backtest
start: 2024-02-10 00:00:00
end: 2025-02-08 08:00:00
period: 1h
basePeriod: 1h
exchanges: [{"eid":"Futures_Binance","currency":"BTC_USDT"}]
*/

//@version=5
strategy("BTC 15分钟动态止盈策略", overlay=true)

// === 参数设置 ===
// EMA 参数
ema_short_length = input.int(50, title="短期EMA长度", minval=1)
ema_long_length = input.int(200, title="长期EMA长度", minval=1)

// MACD 参数
macd_fast_length = input.int(12, title="MACD快速线长度", minval=1)
macd_slow_length = input.int(26, title="MACD慢速线长度", minval=1)
macd_signal_length = input.int(9, title="MACD信号线长度", minval=1)

// RSI 参数
rsi_length = input.int(14, title="RSI长度", minval=1)
rsi_overbought = input.int(70, title="RSI超买区", minval=1, maxval=100)
rsi_oversold = input.int(30, title="RSI超卖区", minval=1, maxval=100)

// 止损参数
stop_loss_pct = input.float(1.5, title="止损百分比", minval=0.1)

// === 指标计算 ===
// 均线
ema_short = ta.ema(close, ema_short_length)
ema_long = ta.ema(close, ema_long_length)

// MACD
[macd_line, signal_line, _] = ta.macd(close, macd_fast_length, macd_slow_length, macd_signal_length)

// RSI
rsi = ta.rsi(close, rsi_length)

// === 趋势过滤 ===
bullish_trend = ema_short > ema_long  // 多头趋势:短期均线高于长期均线
bearish_trend = ema_short < ema_long  // 空头趋势:短期均线低于长期均线

// === 买入条件 ===
// 1. EMA 显示多头趋势
// 2. MACD 金叉(MACD 线向上突破信号线)
// 3. RSI 不在超买区域
buy_signal = bullish_trend and ta.crossover(macd_line, signal_line) and rsi < rsi_overbought

// === 危险信号(动态止盈条件) ===
// 1. 趋势反转:短期均线跌破长期均线,或者价格跌破短期均线
// 2. MACD 死叉:MACD 线向下跌破信号线
// 3. RSI:RSI 超买并开始回落
danger_signal = bearish_trend or close < ema_short or ta.crossunder(macd_line, signal_line) or (rsi > rsi_overbought and ta.falling(rsi, 2))  // 检查 RSI 最近2周期是否下降

// === 策略执行 ===
if (buy_signal)
    strategy.entry("Buy", strategy.long)

// 动态止盈和止损
if (strategy.position_size > 0)
    stop_price = strategy.position_avg_price * (1 - stop_loss_pct / 100)  // 固定止损
    strategy.exit("Exit", from_entry="Buy", stop=stop_price, when=danger_signal)

// === 绘制图表 ===
// EMA 绘制
plot(ema_short, color=color.blue, title="短期EMA")
plot(ema_long, color=color.orange, title="长期EMA")

// MACD 绘制
plot(macd_line, color=color.green, title="MACD线")
plot(signal_line, color=color.red, title="信号线")

// RSI 超买/超卖区域
hline(rsi_overbought, "RSI超买区", color=color.red, linestyle=hline.style_dotted)
hline(rsi_oversold, "RSI超卖区", color=color.green, linestyle=hline.style_dotted)

// 背景颜色:显示趋势
bgcolor(bullish_trend ? color.new(color.green, 90) : color.new(color.red, 90), title="趋势背景")