Momentum-Driven Keltner Channel Breakout Trading Strategy

Overview
This strategy combines Keltner Channels and Momentum indicators to identify potential breakout trading opportunities and determine market trend strength. The strategy monitors price breakouts of Keltner Channels while using the Momentum indicator to confirm trend strength for making trading decisions.
Strategy Principles
The core logic is based on two main technical indicators:
- Keltner Channels (KC):
- Middle line: 20-period Exponential Moving Average (EMA)
- Upper/Lower bands: Middle line ±1.5 times Average True Range (ATR)
- Momentum Indicator:
- Calculates price rate of change over 14 periods
- Positive values indicate bullish momentum, negative values indicate bearish momentum
Trading signal rules:
- Long entry: Price breaks above upper band and momentum is positive
- Short entry: Price breaks below lower band and momentum is negative
- Exit conditions: Price crosses middle band or momentum reverses
Strategy Advantages
- High signal reliability: Combines trend and momentum confirmation
- Reasonable risk control: Uses Keltner Channel middle line as stop loss
- Strong adaptability: Applicable in different market conditions
- Adjustable parameters: Easy to optimize for different instruments
- Clear logic: Trading rules are explicit, easy to implement and backtest
Strategy Risks
- False breakout signals in ranging markets
- Potential lag at trend reversal points
- Parameter sensitivity affecting strategy performance
- Trading costs impact on strategy returns
- Wide stop loss distances in high volatility periods
Risk control suggestions:
- Set maximum position limits
- Dynamically adjust parameters based on volatility
- Add trend confirmation filters
- Consider fixed stop loss levels
Optimization Directions
- Dynamic Parameter Optimization:
- Adapt channel width based on volatility
- Adjust momentum period based on market cycles
- Signal Filter Enhancement:
- Add volume confirmation conditions
- Incorporate additional technical indicators
- Stop Loss/Profit Optimization:
- Implement dynamic stop loss positioning
- Add trailing stop profit functionality
- Position Management Improvement:
- Dynamically adjust position size based on volatility
- Implement scaled entry and exit
Summary
The strategy combines Keltner Channels and Momentum indicators to create a reliable trend-following trading system. Its strengths lie in high signal reliability and reasonable risk control, though market conditions can impact performance. Through parameter optimization and signal filter improvements, the strategy's stability and profitability can be further enhanced.
/*backtest
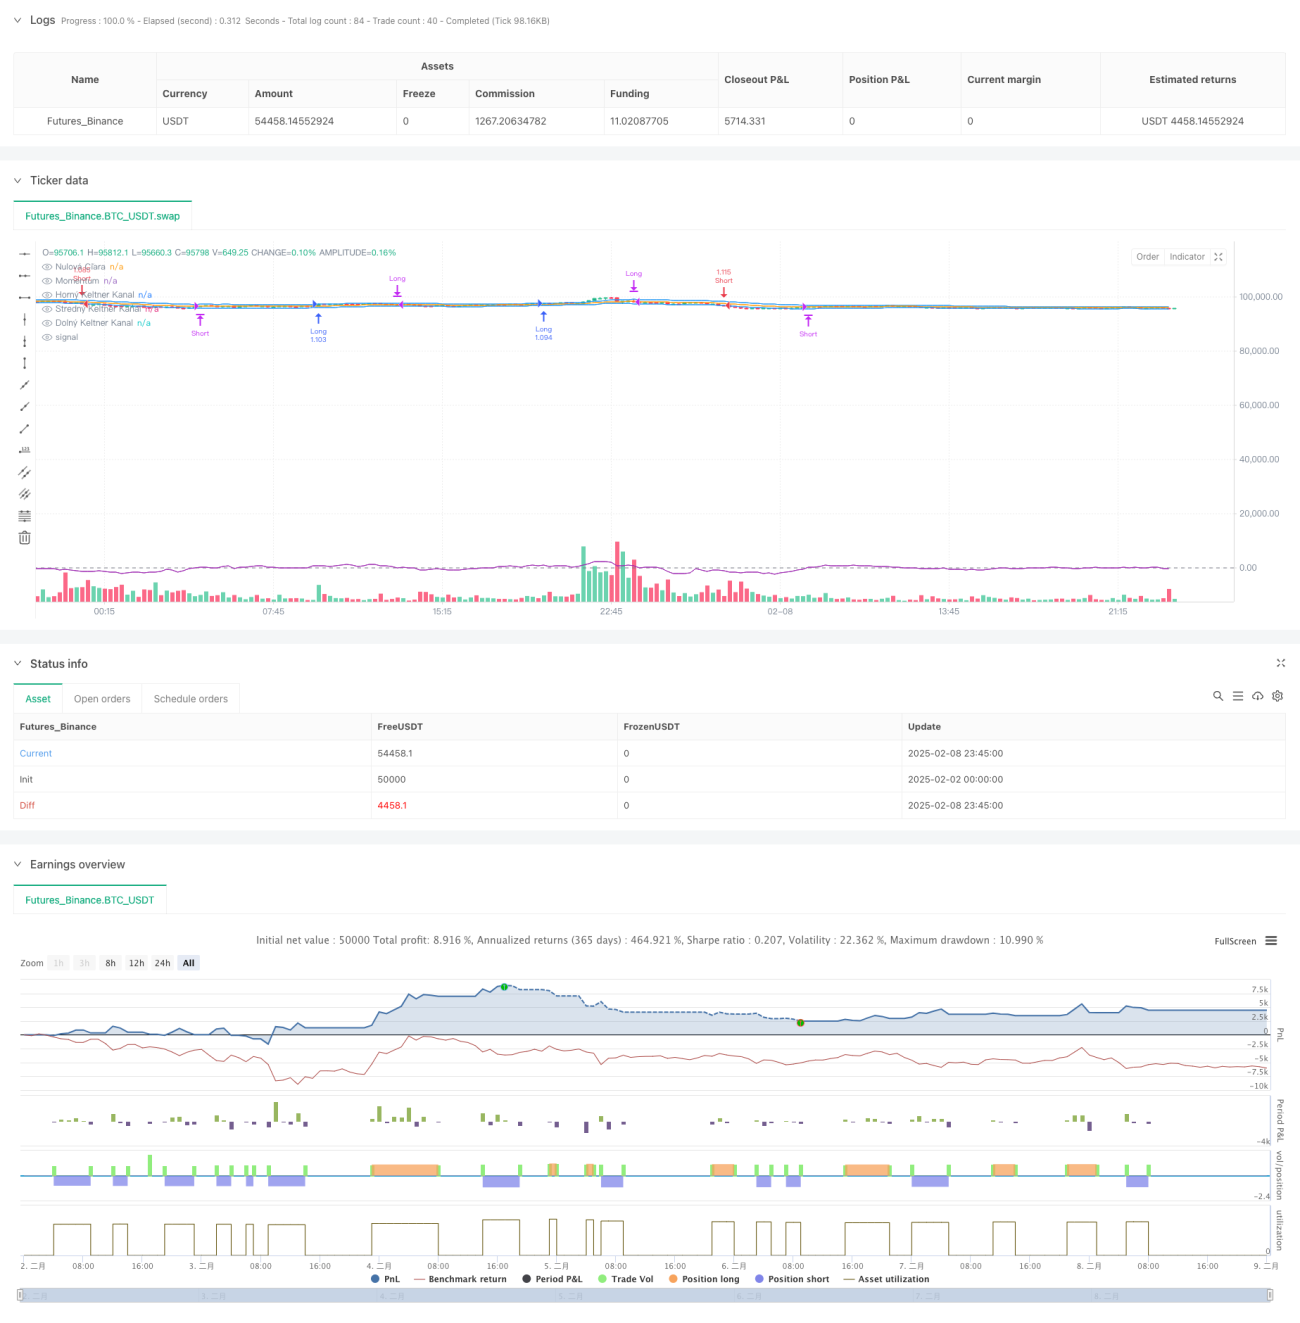
start: 2025-02-02 00:00:00
end: 2025-02-09 00:00:00
period: 15m
basePeriod: 15m
exchanges: [{"eid":"Futures_Binance","currency":"BTC_USDT"}]
*/
//@version=5
strategy("Keltner Channels + Momentum Strategy", overlay=true, default_qty_type=strategy.percent_of_equity, default_qty_value=200)
// Nastavenia Keltner Channels- 1