Dual EMA RSI Momentum Breakout Trading Strategy

Overview
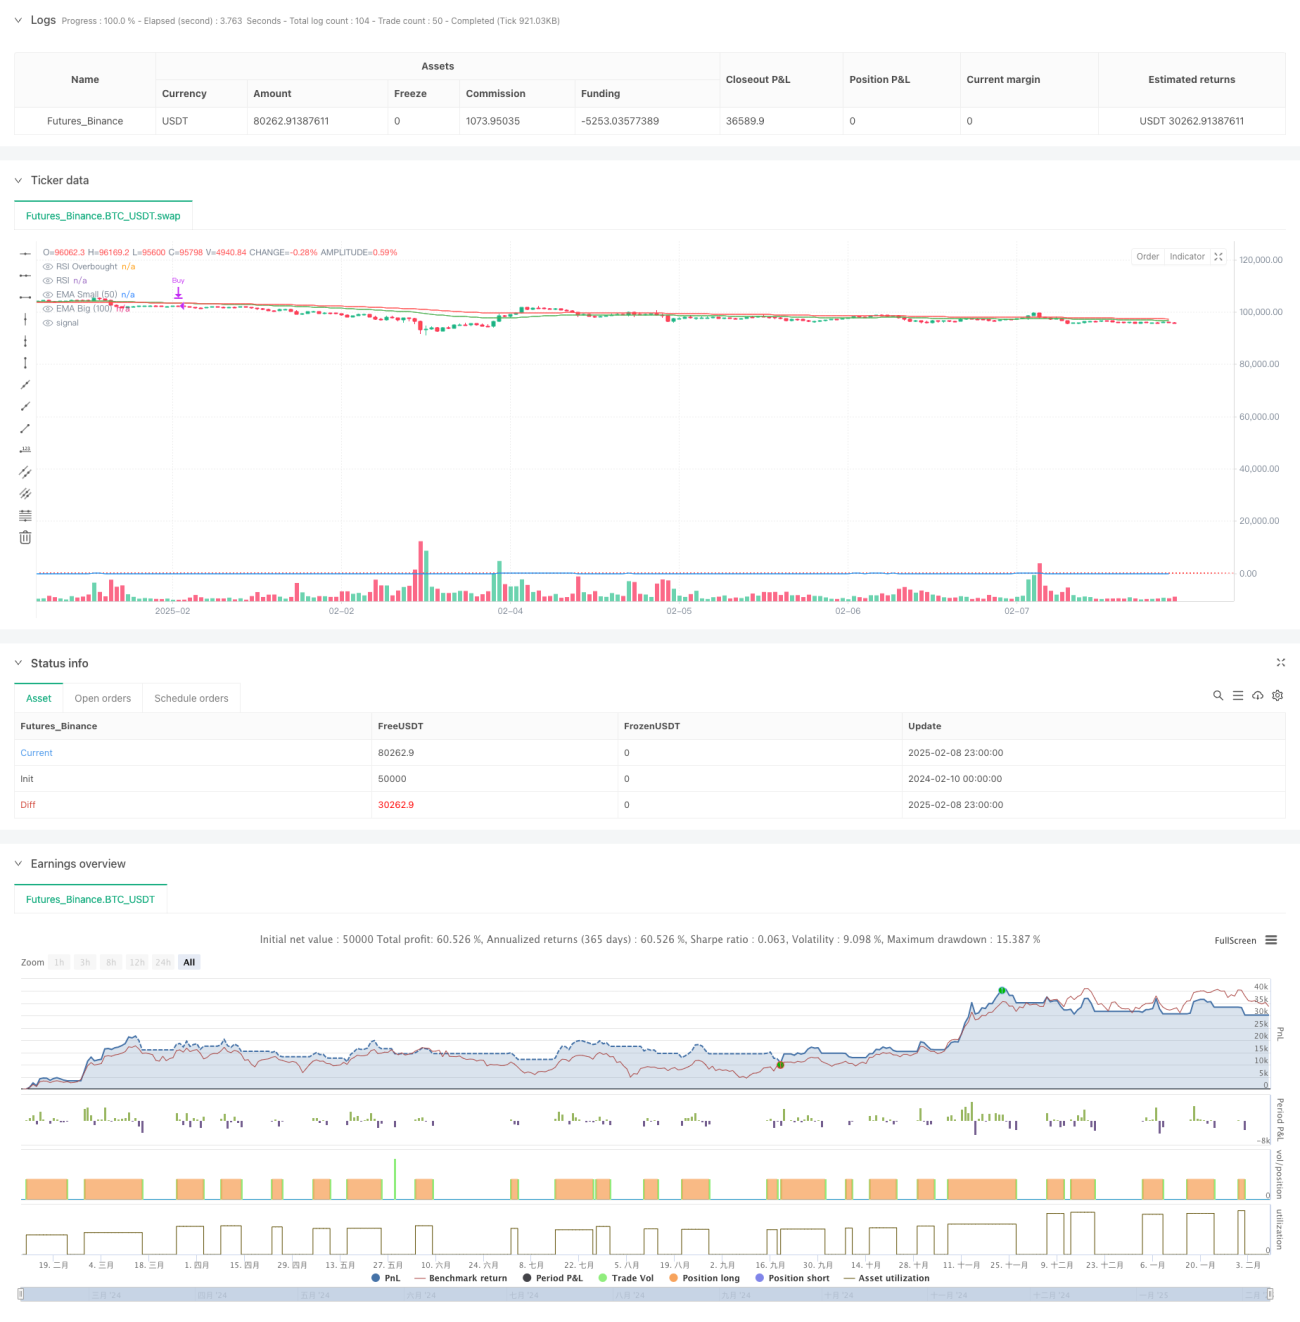
This strategy combines a dual EMA system (50 and 100 periods) with the RSI momentum indicator. It identifies market trends and entry points through EMA crossovers and RSI overbought conditions, while implementing dynamic stop-loss for risk management. The strategy is particularly effective in trending market conditions, capitalizing on trend continuation patterns.
Strategy Principles
The core logic includes the following key elements:
- Uses 50-period and 100-period Exponential Moving Averages (EMA) for trend identification
- Confirms momentum using RSI overbought levels (default 70)
- Enters long positions when EMAs cross bullishly and RSI enters overbought territory
- Exits positions when the shorter EMA crosses below the longer EMA
- Sets dynamic stop-loss at EMA crossover points
Strategy Advantages
- Combines trend and momentum confirmation for improved signal reliability
- Uses classic technical indicators, making it clear and easy to understand
- Dynamic stop-loss mechanism effectively controls risk and prevents excessive drawdowns
- Highly adjustable parameters for different market conditions
- Clean code structure for easy maintenance and optimization
Strategy Risks
- May generate frequent false breakout signals in ranging markets
- RSI overbought condition might cause missing important trend initiations
- EMA system has inherent lag, potentially affecting entry and exit timing
- Stop-loss positioning might not be responsive enough in highly volatile markets
- Limited to long positions, restricting strategy versatility
Strategy Optimization Directions
- Implement market condition recognition for adaptive parameter settings
- Incorporate volume indicators for additional confirmation
- Enhance stop-loss mechanism with trailing stops
- Add short-selling capability for comprehensive market coverage
- Include volatility filters to avoid excessive market volatility
- Introduce position sizing system based on market risk assessment
Summary
This trend-following strategy, built on classical technical analysis principles, effectively balances profit opportunities and risk control through the combination of EMA system and RSI indicator. Its main strengths lie in its clear logic and controllable risk, though it requires appropriate parameter optimization and strategy improvements based on market conditions. For investors seeking medium to long-term trend trading opportunities, this serves as a valuable basic strategy framework.
- 1