Dual EMA-RSI Momentum Trend Following Strategy

Overview
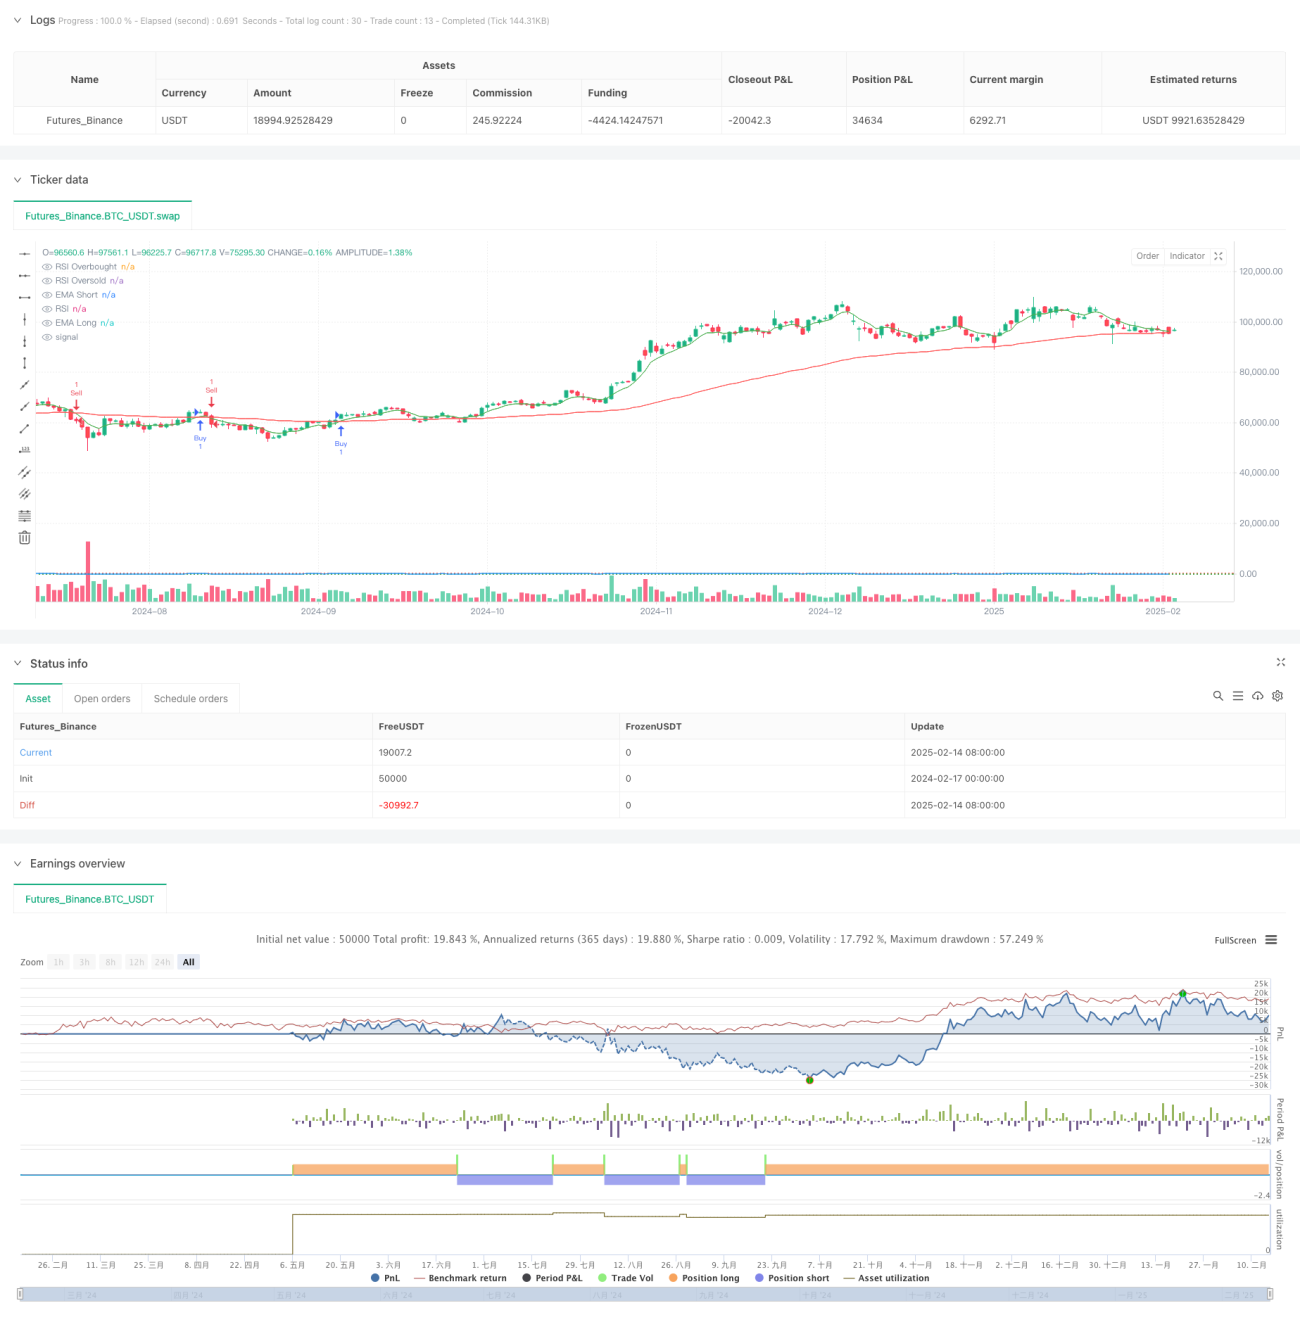
This strategy is a trend-following trading system based on dual EMAs and RSI indicator. It combines EMA crossover signals, RSI overbought/oversold conditions, and price breakthrough confirmation to build a multi-filtered trading decision framework. The strategy uses 6-period and 82-period Exponential Moving Averages (EMA) to capture medium and short-term trends, while utilizing the Relative Strength Index (RSI) to filter market overheating and overcooling conditions, and finally confirms trading signals through price breakouts.
Strategy Principles
The core logic includes three dimensions of signal filtering:
- Trend Determination: Uses crossovers between fast EMA (6-period) and slow EMA (82-period) to judge trend direction. Long signals are generated when the fast line crosses above the slow line, and short signals when the fast line crosses below.
- Momentum Filtering: Uses 14-period RSI to filter excessive trend chasing. Market is considered overbought when RSI exceeds 70 (suppressing longs), and oversold when RSI falls below 22 (suppressing shorts).
- Price Confirmation: Requires price breakthrough confirmation for entry. Long positions require closing price to make new highs, while short positions require new lows.
Strategy Advantages
- Multiple Signal Filtering: Effectively reduces false signals through combination of technical indicators and price action.
- Trend Following with Momentum Integration: Captures sustained trends while avoiding excessive trend chasing.
- Strong Parameter Adaptability: Key parameters like EMA periods and RSI thresholds can be optimized for different market characteristics.
- Comprehensive Risk Control: Built-in risk control mechanism through RSI overbought/oversold conditions.
Strategy Risks
- Choppy Market Risk: EMA crossover signals may occur frequently in sideways markets, leading to overtrading.
- Lag Risk: Both EMA and RSI have inherent lag, potentially causing delayed reactions to rapid market turns.
- Parameter Sensitivity: Strategy performance is sensitive to parameter selection, different market environments may require different parameter combinations.
- Signal Scarcity: Multiple filtering mechanisms may result in fewer valid signals, affecting profit opportunities.
Strategy Optimization Directions
- Dynamic Parameter Adjustment: Introduce adaptive mechanisms to dynamically adjust EMA periods and RSI thresholds based on market volatility.
- Stop Loss Implementation: Add trailing or fixed stop loss rules to enhance risk control capabilities.
- Market Environment Classification: Add market state identification module to use different parameter combinations in different market conditions.
- Signal Strength Grading: Design a grading system based on signal condition satisfaction levels to adjust position sizing.
Summary
The strategy constructs a logically rigorous trend-following system through clever combination of EMA system and RSI indicator. While the multiple filtering mechanisms effectively control risk, they may also miss some trading opportunities. Through continuous optimization and improvement, the strategy shows promise in maintaining stable performance across different market environments.
- 1