
Overview
This strategy combines the DMI (Directional Movement Index) and ADX (Average Directional Index) indicators to identify strong market trends and capture trading opportunities. The strategy uses DMI's +DI and -DI line crossovers to determine trend direction while utilizing the ADX indicator to measure trend strength, only entering trades when trends are clearly established. This is a complete trend following trading system that includes entry signals and risk management features like stop-loss and take-profit levels.
Strategy Principles
The core logic includes several key elements:
- Uses DMI indicator's +DI and -DI lines to judge trend direction, generating long signals when +DI crosses above -DI and short signals when +DI crosses below -DI
- Uses ADX indicator to assess trend strength, with a default threshold of 25, only allowing trades when ADX exceeds the threshold to avoid false signals in choppy markets
- Employs percentage-based stop-loss and take-profit levels for risk control, with default settings of 1% stop-loss and 2% take-profit from entry price
- Strategy parameters are adjustable, including DMI period, ADX period and smoothing parameters, ADX threshold, and stop-loss/take-profit percentages
Strategy Advantages
- Combines trend direction and strength assessment for more reliable trading signals
- Only trades in strong trends, avoiding frequent trading in choppy markets
- Complete risk control system with clear stop-loss and take-profit levels
- Flexible parameters that can adapt to different market conditions
- Clear and simple strategy logic that's easy to understand and execute
- Suitable for medium to long-term trend following and short-term trading
Strategy Risks
- Potential for significant drawdowns during trend reversals
- DMI and ADX are lagging indicators, signals may be relatively delayed
- Improper parameter settings can affect strategy performance
- Consecutive stops possible in choppy markets
- Need to consider impact of trading costs on strategy returns
Mitigation measures:
- Optimize parameter settings to balance signal lag and accuracy
- Combine with other technical indicators for signal confirmation
- Implement proper position sizing
- Regular backtesting to verify strategy effectiveness
Strategy Optimization Directions
- Signal Optimization:
- Add trend confirmation indicators like moving averages
- Optimize dynamic adjustment mechanism for ADX threshold
- Consider incorporating volume indicators for auxiliary judgment
- Risk Control Optimization:
- Introduce dynamic stop-loss mechanisms
- Optimize position management methods
- Add maximum drawdown controls
- Parameter Optimization:
- Develop adaptive parameter adjustment mechanisms
- Set parameter combinations for different market environments
- Optimize stop-loss and take-profit ratio settings
Summary
The DMI+ADX crossover strategy is a classic trend following strategy that combines directional and strength indicators to find trading opportunities in strong trend markets. The strategy features clear logic, comprehensive risk control, and good practicality and scalability. Through continuous optimization and improvement, the strategy can better adapt to different market environments and enhance trading performance.
/*backtest
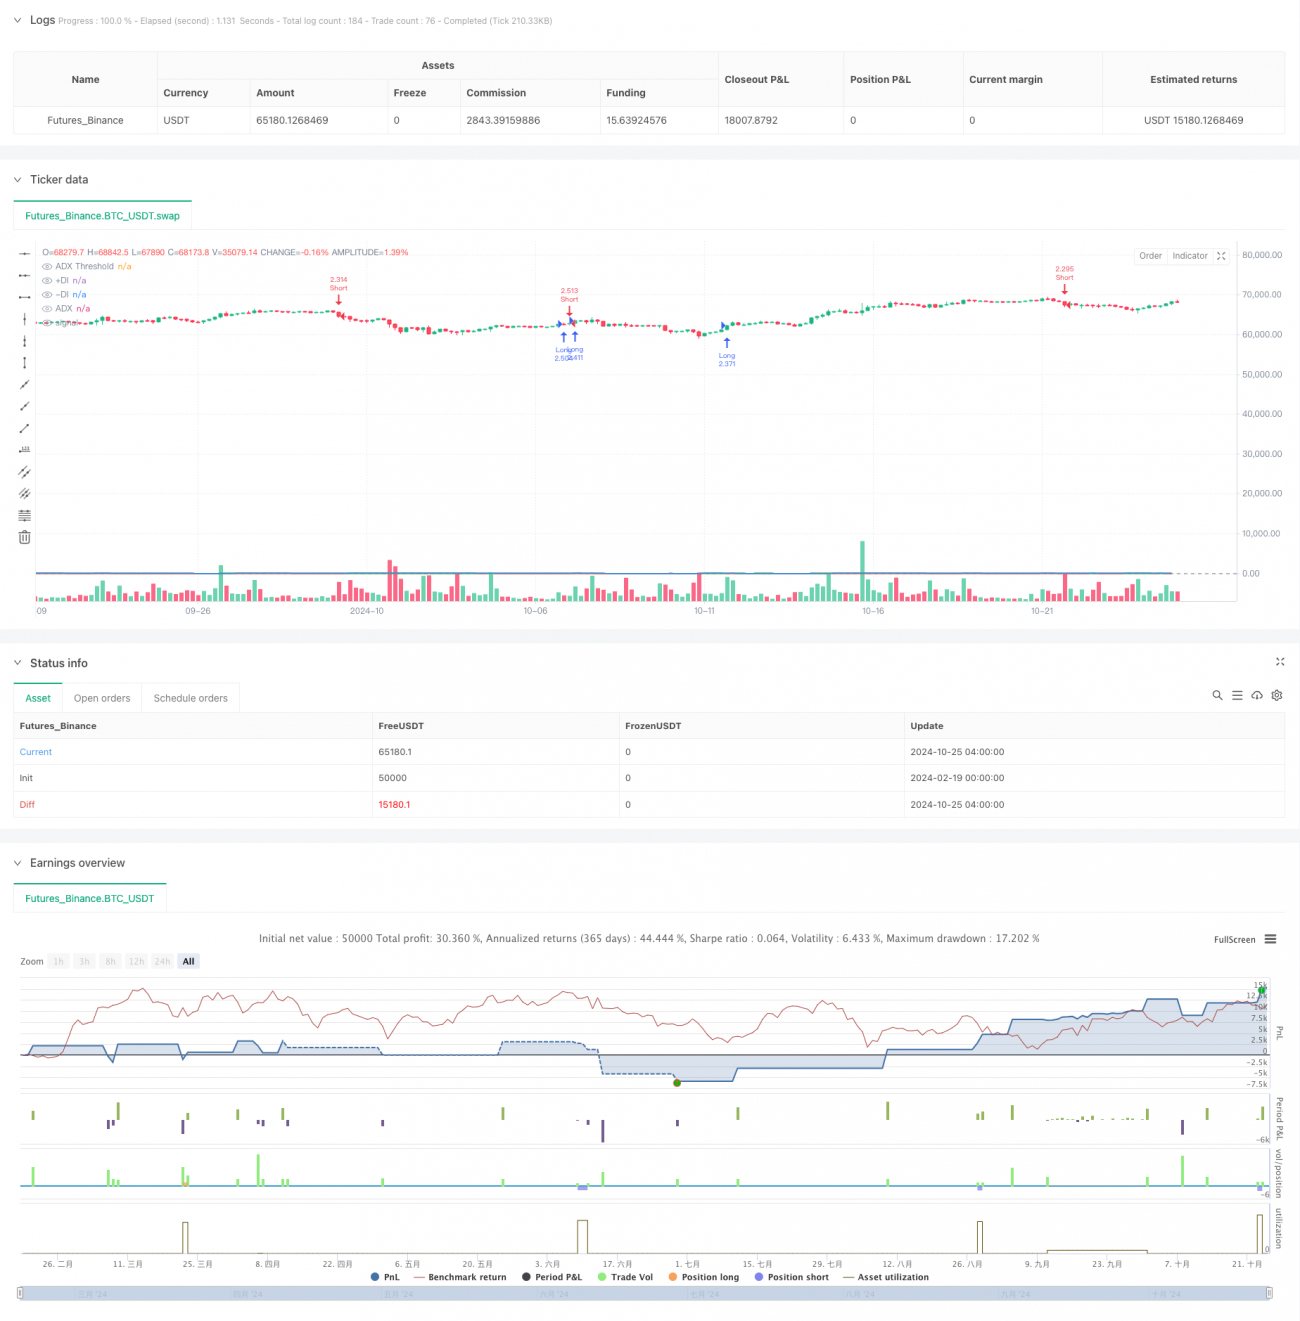
start: 2024-02-19 00:00:00
end: 2024-10-25 08:00:00
period: 4h
basePeriod: 4h
exchanges: [{"eid":"Futures_Binance","currency":"BTC_USDT"}]
*/
//@version=6
strategy("DMI + ADX Strategy", overlay=true, default_qty_type=strategy.percent_of_equity, default_qty_value=250)
// Nastavenie parametrov- 1