
Overview
This is a comprehensive trading strategy that combines Bollinger Bands and Parabolic SAR (PSAR) indicators, utilizing a fixed risk-reward ratio for trade management. The strategy operates during intraday trading hours, identifying trading opportunities through price breakouts of Bollinger Bands and candlestick patterns, while using the PSAR indicator for trend confirmation. The strategy implements dynamic stop-loss and take-profit targets, maintaining a 1:3 risk-reward ratio.
Strategy Principles
The strategy employs multiple technical indicators for trade signal confirmation:
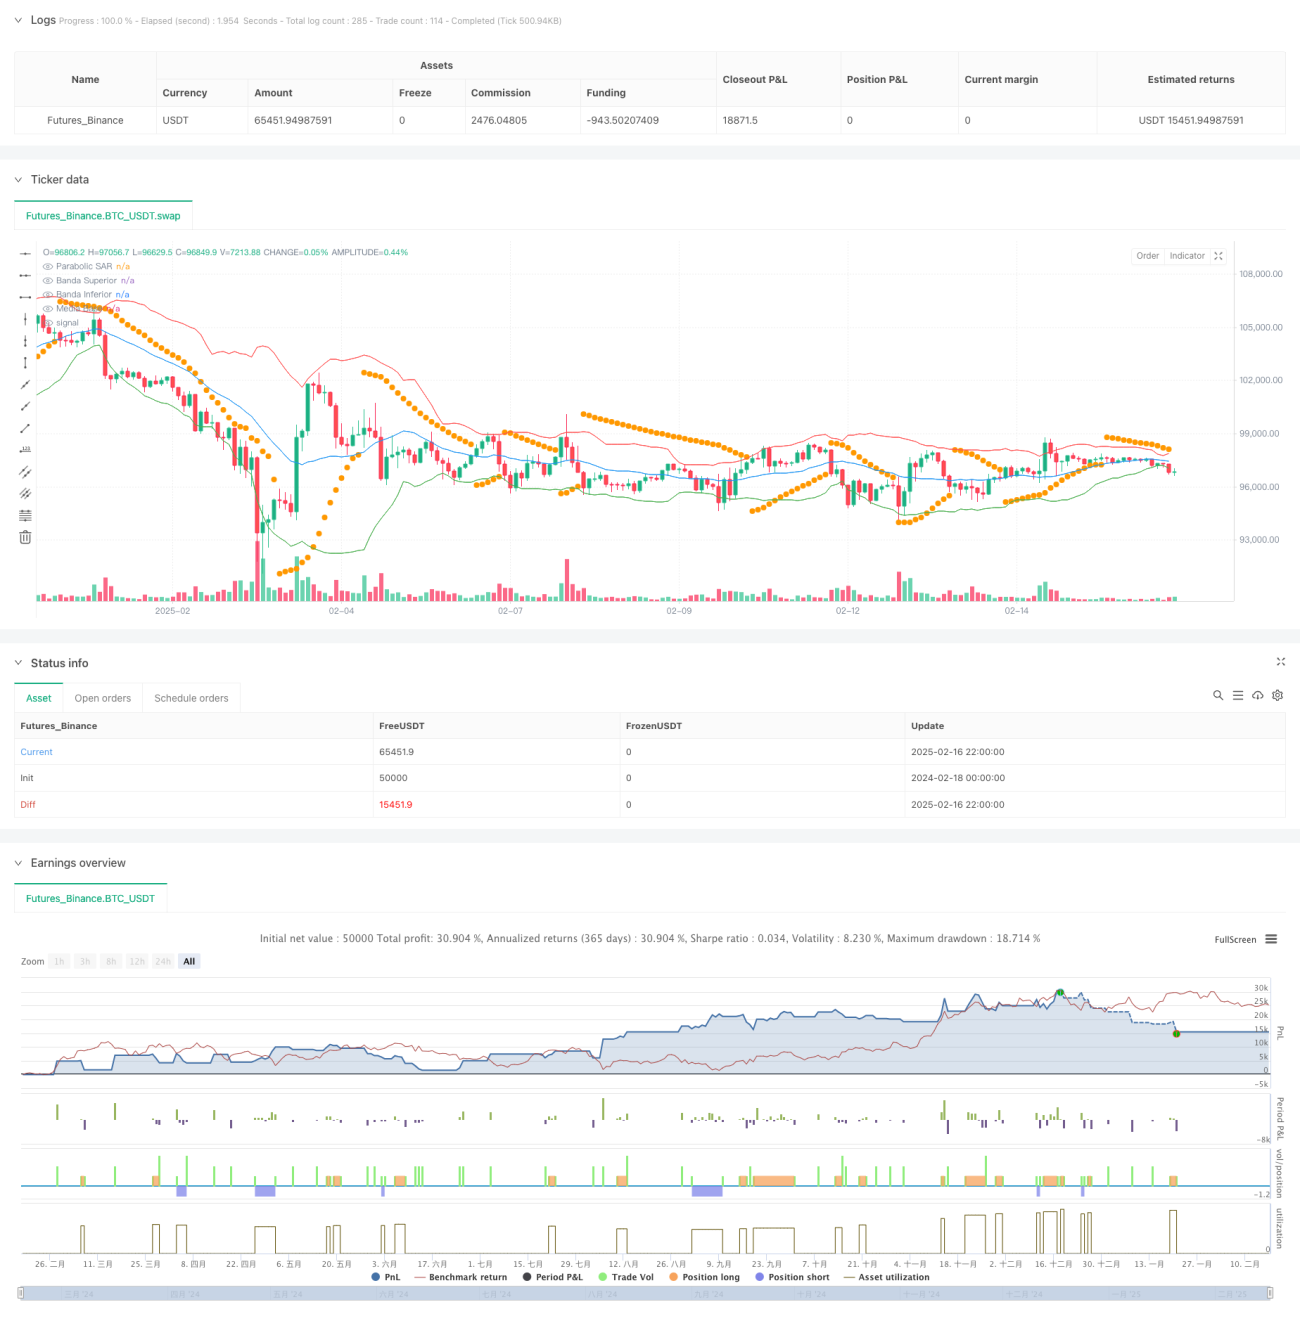
- Uses 20-period Bollinger Bands as the primary price volatility indicator
- Incorporates PSAR indicator (initial value 0.02, maximum 0.2) as a trend confirmation tool
- Calculates candlestick body ratio (body length/total length ≥0.33) to ensure signal reliability
- Executes trades within specified trading window (GMT-5 7:30-16:00)
- Long entry conditions: close above upper band with qualifying candle body ratio
- Short entry conditions: close below lower band with qualifying candle body ratio
Strategy Advantages
- Integration of multiple technical indicators enhances signal reliability
- Fixed risk-reward ratio (1:3) promotes long-term stable returns
- Time filtering prevents interference during low liquidity periods
- Candlestick body ratio filtering reduces false breakouts
- Dynamic stop-loss and take-profit targets adapt to market volatility
- Clear strategy logic facilitates understanding and optimization
Strategy Risks
- Potential slippage in high volatility markets
- Fixed risk-reward ratio might miss some profit opportunities
- Time filtering could miss important market moves
- Multiple indicators may lead to signal lag
- Consecutive losses possible in ranging markets
Strategy Optimization Directions
- Implement adaptive Bollinger Band periods for different market conditions
- Develop dynamic risk-reward ratio mechanism
- Add volume indicators for confirmation
- Optimize PSAR parameters for better trend following
- Incorporate market volatility filters
- Develop smarter time filtering mechanisms
Summary
The strategy creates a complete trading system through the combined use of Bollinger Bands, PSAR indicators, and candlestick analysis. Its core strength lies in the synergy of multiple technical indicators and strict risk management. While inherent risks exist, the suggested optimization directions can further enhance strategy stability and profitability. The strategy is particularly suitable for intraday traders, capable of generating stable returns while maintaining risk control.
- 1