
Overview
This strategy is a dynamic equilibrium trading system based on multiple technical indicators. It integrates various technical analysis tools including Relative Strength Index (RSI), Bollinger Bands (BB), Exponential Moving Average (EMA), and Moving Average Convergence Divergence (MACD) to identify market opportunities through cross-validation between indicators. The strategy employs percentage-based position management, defaulting to 10% of total assets per trade, which helps control risk.
Strategy Principles
The core logic of the strategy is to enhance trading signal reliability through multiple indicator confirmation. Specifically:
- Uses 14-period RSI to monitor market overbought/oversold conditions
- Employs 20-period, 2-standard deviation Bollinger Bands to determine price volatility ranges
- Utilizes 50 and 200-period EMAs to judge medium and long-term trends
- Adopts MACD(12,26,9) parameter combination to capture trend reversal points
Buy signals require at least two of the following conditions:
- RSI below 30 (oversold zone)
- Price touching lower Bollinger Band
- Fast EMA crossing above slow EMA
- MACD line crossing above signal line
Sell signals trigger when either:
- RSI above 70 (overbought zone)
- Price breaking above upper Bollinger Band
Strategy Advantages
- Multiple indicator cross-validation improves signal reliability
- Percentage-based position management effectively controls risk
- Combines benefits of trend following and range trading
- Flexible signal conditions with strong adaptability
- Graphical interface provides intuitive signal display
Strategy Risks
- Multiple indicators may lead to signal lag
- May generate excessive false signals in ranging markets
- Fixed parameters may not adapt to changing market conditions
- Lack of volume consideration might affect judgment accuracy
- Relatively simple money management approach may impact returns
Strategy Optimization Directions
- Incorporate volume indicators as auxiliary confirmation
- Develop adaptive parameter adjustment mechanisms
- Refine money management strategy
- Add stop-loss and trailing stop mechanisms
- Include market environment recognition module
- Optimize signal filtering mechanism
Summary
This strategy constructs a relatively complete trading system through the combined application of multiple technical indicators. Cross-validation between indicators enhances trading signal reliability. While adopting conservative position management to control risk, there are aspects requiring optimization, but the overall framework design is reasonable and has practical application value.
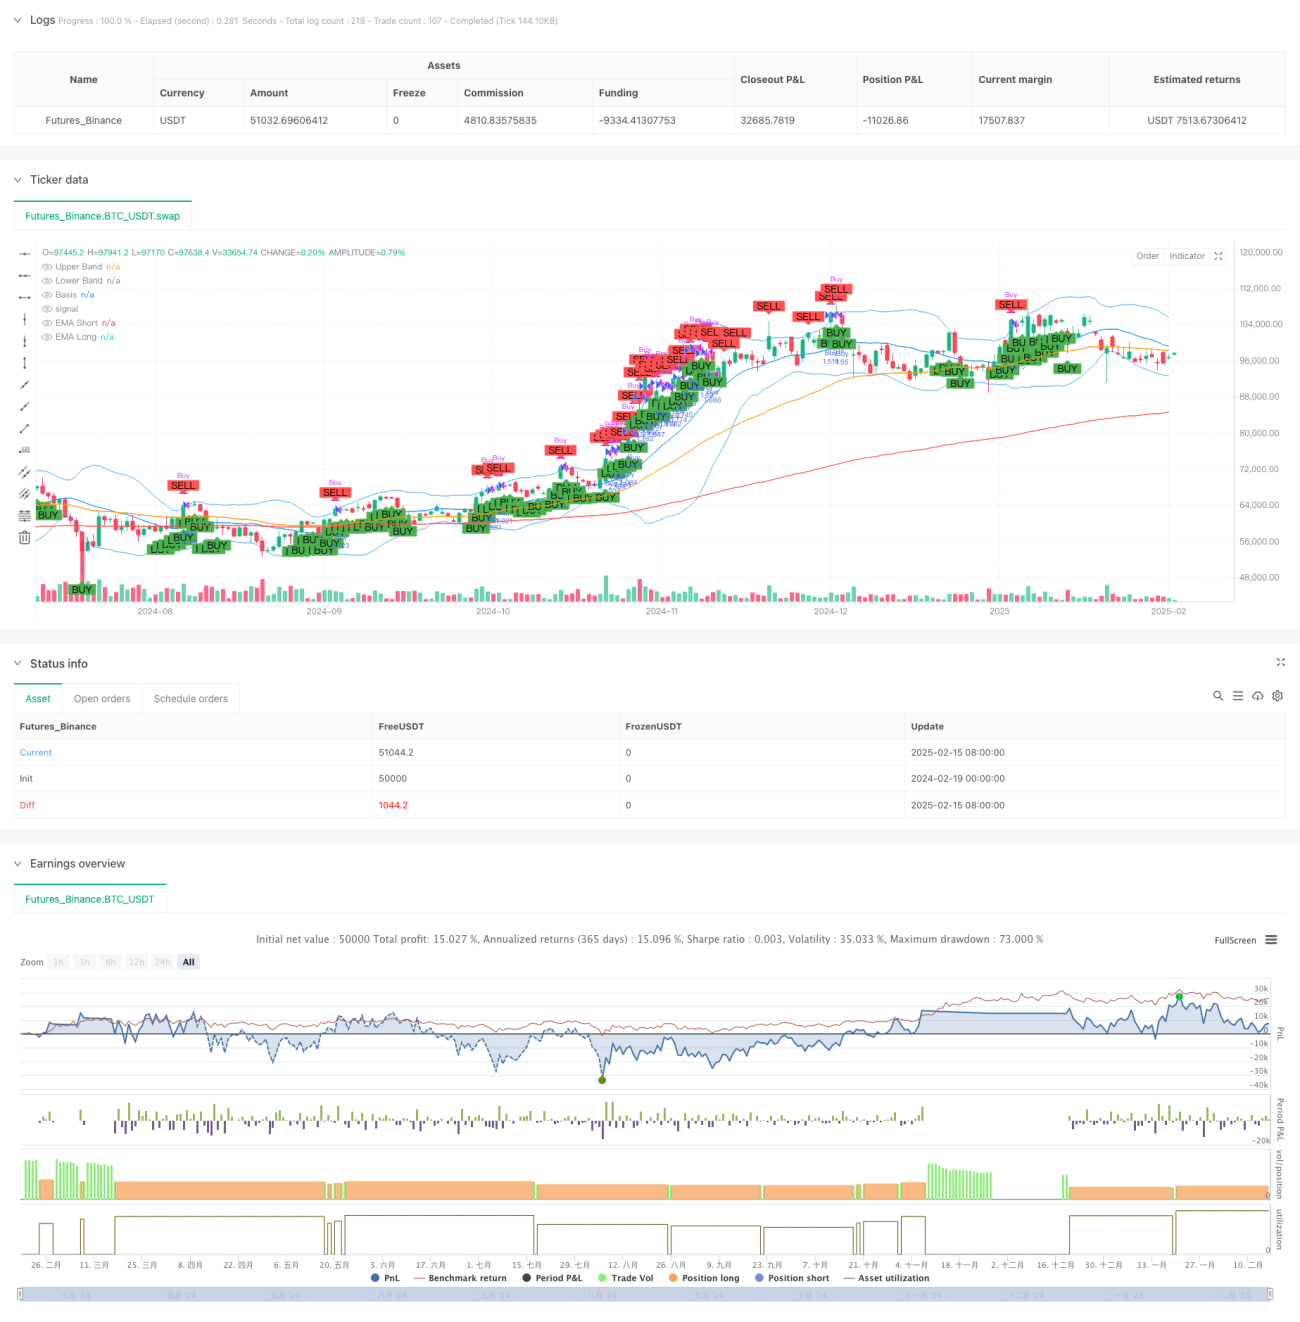
/*backtest
start: 2024-02-19 00:00:00
end: 2025-02-16 08:00:00
period: 1d
basePeriod: 1d
exchanges: [{"eid":"Futures_Binance","currency":"BTC_USDT"}]
*/

//@version=5
strategy("ETH/USDT Multi-Indicator Strategy", overlay=true, default_qty_type=strategy.percent_of_equity, default_qty_value=250)

// Parametri za RSI- 1