Bollinger Bands Crossover Signal Filtering Strategy

Overview
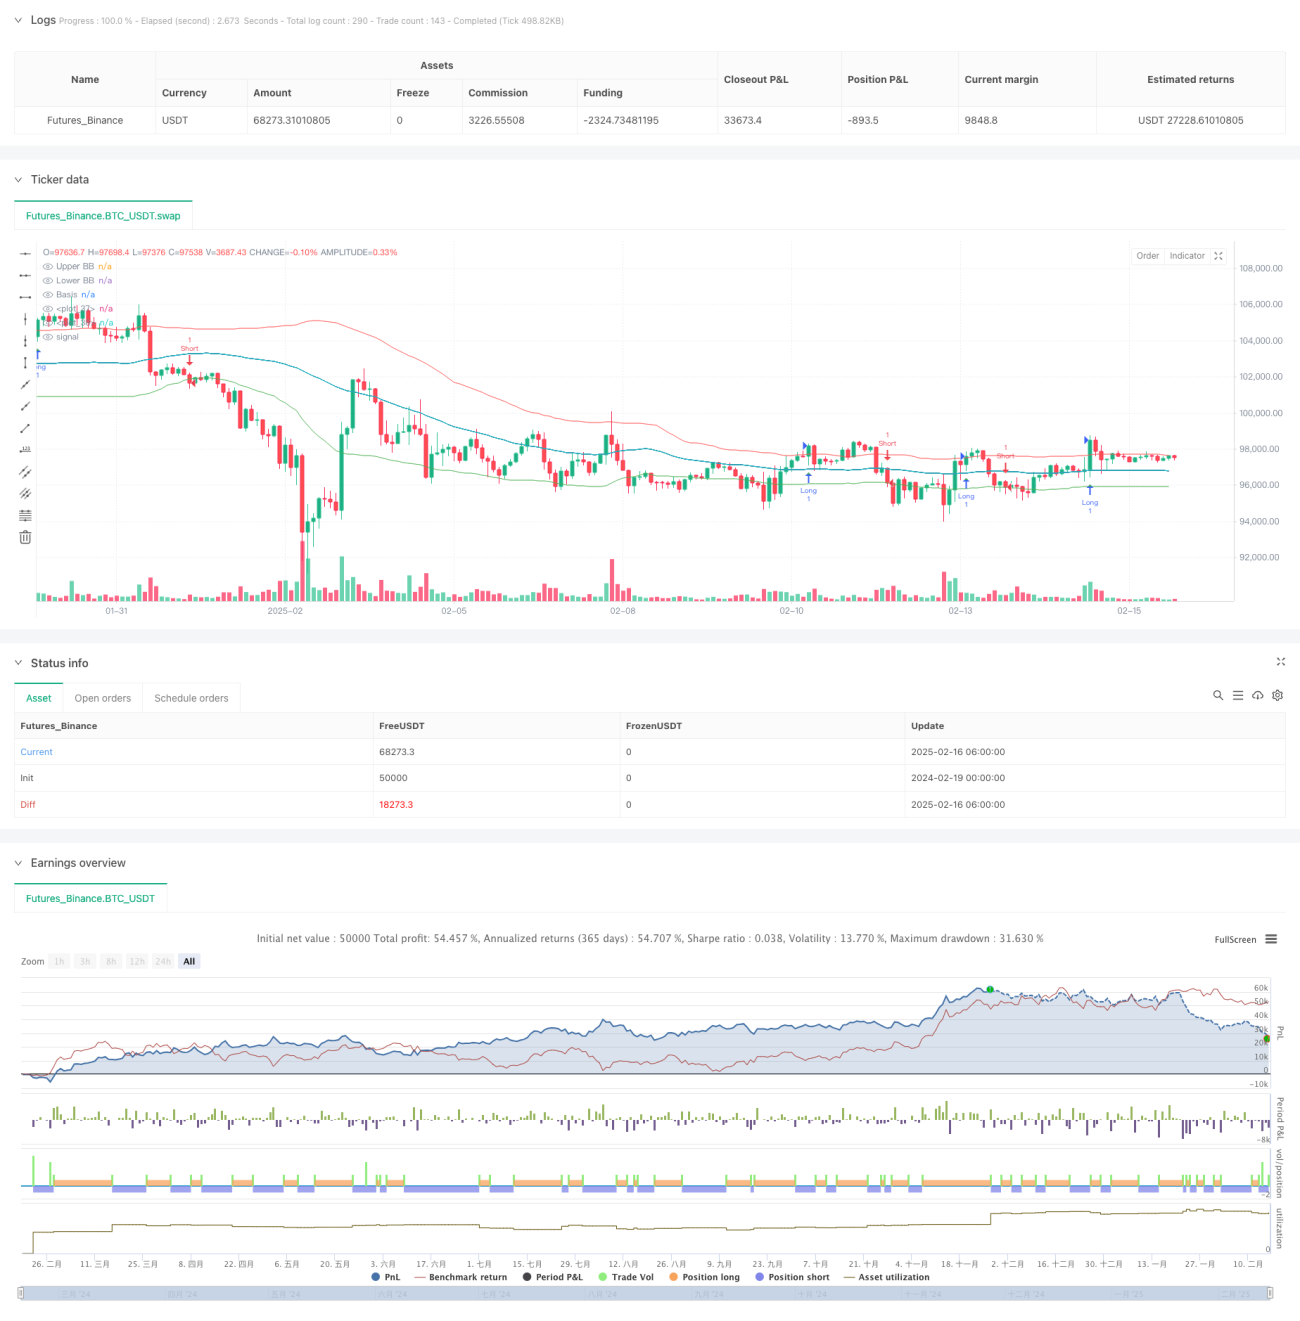
This is a trading strategy based on Bollinger Bands indicator that identifies market trends and generates trading signals through price crossovers with the bands. The strategy uses a 55-period moving average as the middle band and 1.0 standard deviation for calculating the upper and lower bands. The core concept is to determine long and short entry points through price breakouts of the Bollinger Bands.
Strategy Principles
The strategy operates on the following key components:
- Bollinger Bands Calculation: Uses 55-period Simple Moving Average (SMA) as the middle band, with a standard deviation multiplier of 1.0 for upper and lower bands.
- Signal Generation Logic:
- Long signal generated when closing price breaks above the upper band
- Short signal generated when closing price breaks below the lower band
- Signal Confirmation Mechanism: Uses the barssince function to calculate periods since last breakout, comparing the period distance between long and short signals to determine final trading direction.
- Visualization: Displays trading signals with triangle markers on the chart, using different colors for long and short positions.
Strategy Advantages
- Clear Signals: Generates trading signals through definitive price crossovers with Bollinger Bands, avoiding ambiguous zones.
- Trend Following: The strategy is essentially trend-following, capable of capturing good returns in strong market trends.
- Visual Clarity: Trading signals are highly intuitive through color filling and shape markers.
- Flexible Parameters: Bollinger Bands period and standard deviation multiplier can be adjusted for different market conditions.
- Complete System: Includes comprehensive signal generation, visualization, and alert functions.
Strategy Risks
- Choppy Market Risk: May generate frequent false signals in sideways, volatile markets.
- Lag Risk: Due to the relatively long period (55) of moving average, signals may have some delay.
- Reversal Risk: May suffer significant drawdowns during sudden trend reversals.
- Parameter Sensitivity: Strategy performance is highly dependent on Bollinger Bands parameter selection.
Strategy Optimization Directions
- Volume Confirmation: Add volume indicators as auxiliary conditions for signal confirmation.
- Dynamic Parameter Optimization: Dynamically adjust the standard deviation multiplier based on market volatility.
- Add Trend Filter: Incorporate longer-period trend indicators to filter false signals.
- Improve Stop Loss Mechanism: Add trailing stop or fixed stop loss for better risk control.
- Market State Classification: Add market state identification module to use different parameter settings under different market conditions.
Summary
This is a classic trend-following strategy based on Bollinger Bands, capturing market trends through price crossovers with the bands. The strategy design is clear and concise, featuring good visualization effects and signal generation mechanisms. While it may face challenges in choppy markets, the strategy's stability and reliability can be further enhanced through appropriate parameter optimization and additional auxiliary indicators. Thorough backtesting and parameter optimization are recommended before live trading.
- 1