Multi-Level Support/Resistance Momentum Reversal Trading Strategy

Overview
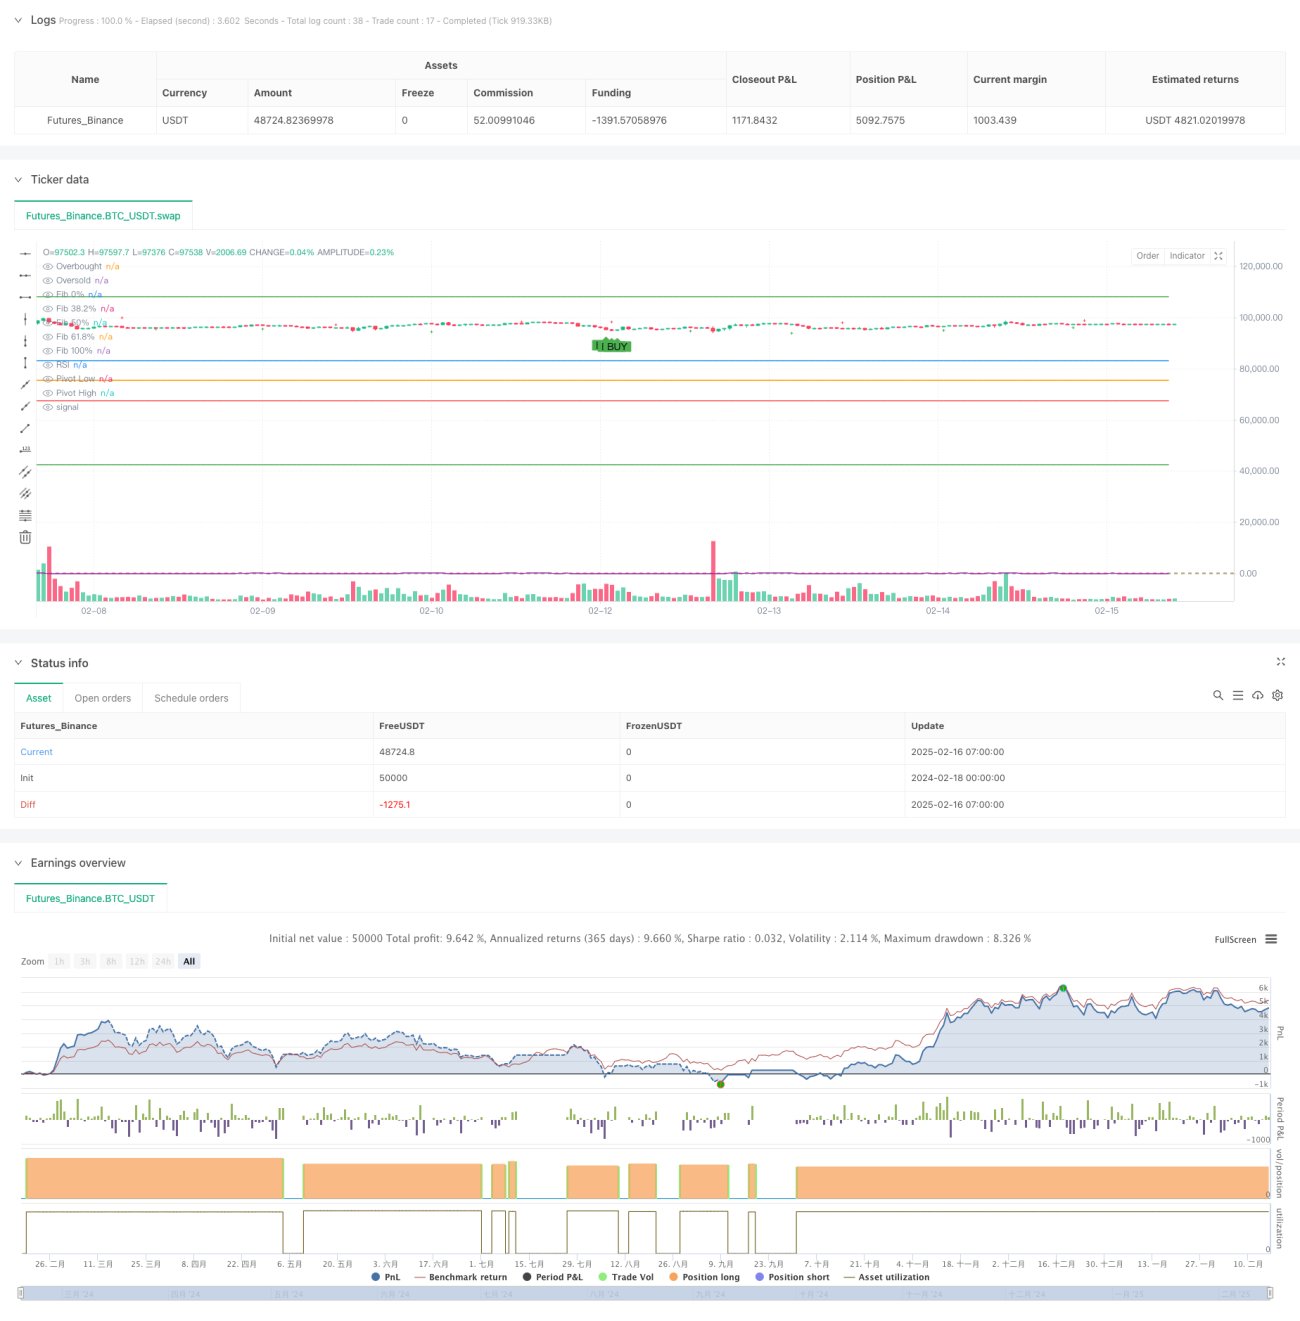
This strategy is a multi-dimensional trading system that combines Fibonacci retracement, pivot points, and the Relative Strength Index (RSI). It captures potential trading opportunities by identifying key support/resistance levels and market overbought/oversold conditions. The strategy employs multiple technical indicators for cross-validation, enhancing the reliability of trading signals.
Strategy Principles
The core logic is based on the synergy of three key components:
- Fibonacci retracement levels (38.2%, 50%, 61.8%) determine potential support/resistance zones, automatically calculated from highs and lows.
- The pivot point system identifies swing highs and lows using a 14-period window, helping determine market structure.
- RSI indicator uses a 14-period setting to identify overbought (>70) and oversold (<30) conditions.
Trade signal triggers:
- Buy signal: Price bounces from Fibonacci retracement levels with RSI in oversold territory
- Sell signal: Price rejects from Fibonacci retracement levels with RSI in overbought territory
Strategy Advantages
- Multi-dimensional analysis improves trading accuracy through cross-validation of technical indicators.
- Strong adaptability with automatic adjustment of support/resistance levels based on market volatility.
- Comprehensive risk management through percentage-based position sizing.
- Excellent visualization allowing traders to intuitively understand market structure and trading signals.
Strategy Risks
- Support/resistance levels may become less effective in highly volatile markets.
- Multiple indicators might lead to lagging signals, affecting entry timing.
- Strategy performance may be suboptimal during strong trend periods.
Risk control recommendations:
- Set appropriate stop-loss levels to avoid significant losses
- Trade cautiously during major economic data releases
- Incorporate higher timeframe trend analysis
Strategy Optimization Directions
-
Indicator Parameter Optimization:
- Consider adjusting RSI periods and thresholds for different market conditions
- Optimize pivot point calculation periods to improve turning point identification
-
Signal Filtering:
- Add volume confirmation
- Introduce trend filters to avoid reversal trades during strong trends
-
Risk Management Enhancement:
- Implement dynamic stop-loss mechanisms
- Adjust position sizes based on volatility
Summary
This is a comprehensive trading system based on multiple technical indicators, capturing market reversal opportunities through the combination of support/resistance levels and momentum indicators. The strategy's strength lies in its multi-dimensional analysis approach and robust risk management mechanisms, but users need to be aware of market conditions' impact on strategy performance and optimize parameters according to actual circumstances.
/*backtest
start: 2024-02-18 00:00:00
end: 2025-02-16 08:00:00
period: 1h
basePeriod: 1h
exchanges: [{"eid":"Futures_Binance","currency":"BTC_USDT"}]
*/

//@version=5
strategy("Fibonacci Retracement + Pivot Points + RSI Strategy", overlay=true, default_qty_type=strategy.percent_of_equity, default_qty_value=20)

// --- Fibonacci Retracement Parameters ---- 1