Overview
This strategy is an automated trading system that combines Exponential Moving Average (EMA) crossovers with the Relative Strength Index (RSI). It identifies trend directions through EMA crossovers while using RSI as a trend confirmation indicator, incorporating comprehensive money management and risk control mechanisms. The system manages each trade with fixed risk and profit targets, ensuring risk consistency through dynamic position sizing.
Strategy Principles
The core logic is based on several key elements: 1. Uses 9-period and 21-period EMAs to identify trend reversal points, with uptrend signals when fast EMA crosses above slow EMA and downtrend signals when it crosses below 2. RSI serves as trend confirmation, requiring RSI>50 for buy signals and RSI<50 for sell signals 3. Risk management system sets maximum loss per trade at 1000 and target profit at 5000, achieving fixed risk-reward ratios through position sizing 4. System employs fixed point (25 points) stop-loss and dynamically calculates position size based on risk amount 5. Trade failure detection mechanism identifies stopped-out trades and marks failure points on the chart
Strategy Advantages
- Combines trend following and momentum confirmation for dual validation, improving signal reliability
- Comprehensive money management system with fixed risk per trade prevents excessive losses
- Clear risk-reward ratio setting (1:5) promotes long-term profitability
- System features automated trade execution, reducing emotional interference
- Visualization of failed trades aids in strategy optimization and backtesting analysis
Strategy Risks
- EMA crossover strategy may generate frequent false signals in ranging markets
- Fixed point stop-loss may lack flexibility in adapting to volatility changes
- Large risk-reward ratio (1:5) might lead to lower win rates
- RSI indicator may become ineffective in extreme market conditions
- Fixed lot size may not suit all market conditions
Strategy Optimization Directions
- Implement adaptive stop-loss mechanism, such as ATR-based dynamic stops
- Add market volatility filters to adjust strategy parameters during high volatility periods
- Consider incorporating volume indicators as additional confirmation tools
- Develop dynamic lot size adjustment mechanism for market adaptability
- Introduce additional trend confirmation tools like MACD or Bollinger Bands
Summary
This strategy builds a complete trading system by combining EMA crossovers and RSI indicators, encompassing signal generation, risk management, and trade execution. While there are areas for optimization, the overall framework is well-designed, particularly in terms of money management considerations. Through further optimization and refinement, this strategy shows promise for improved performance in actual trading.
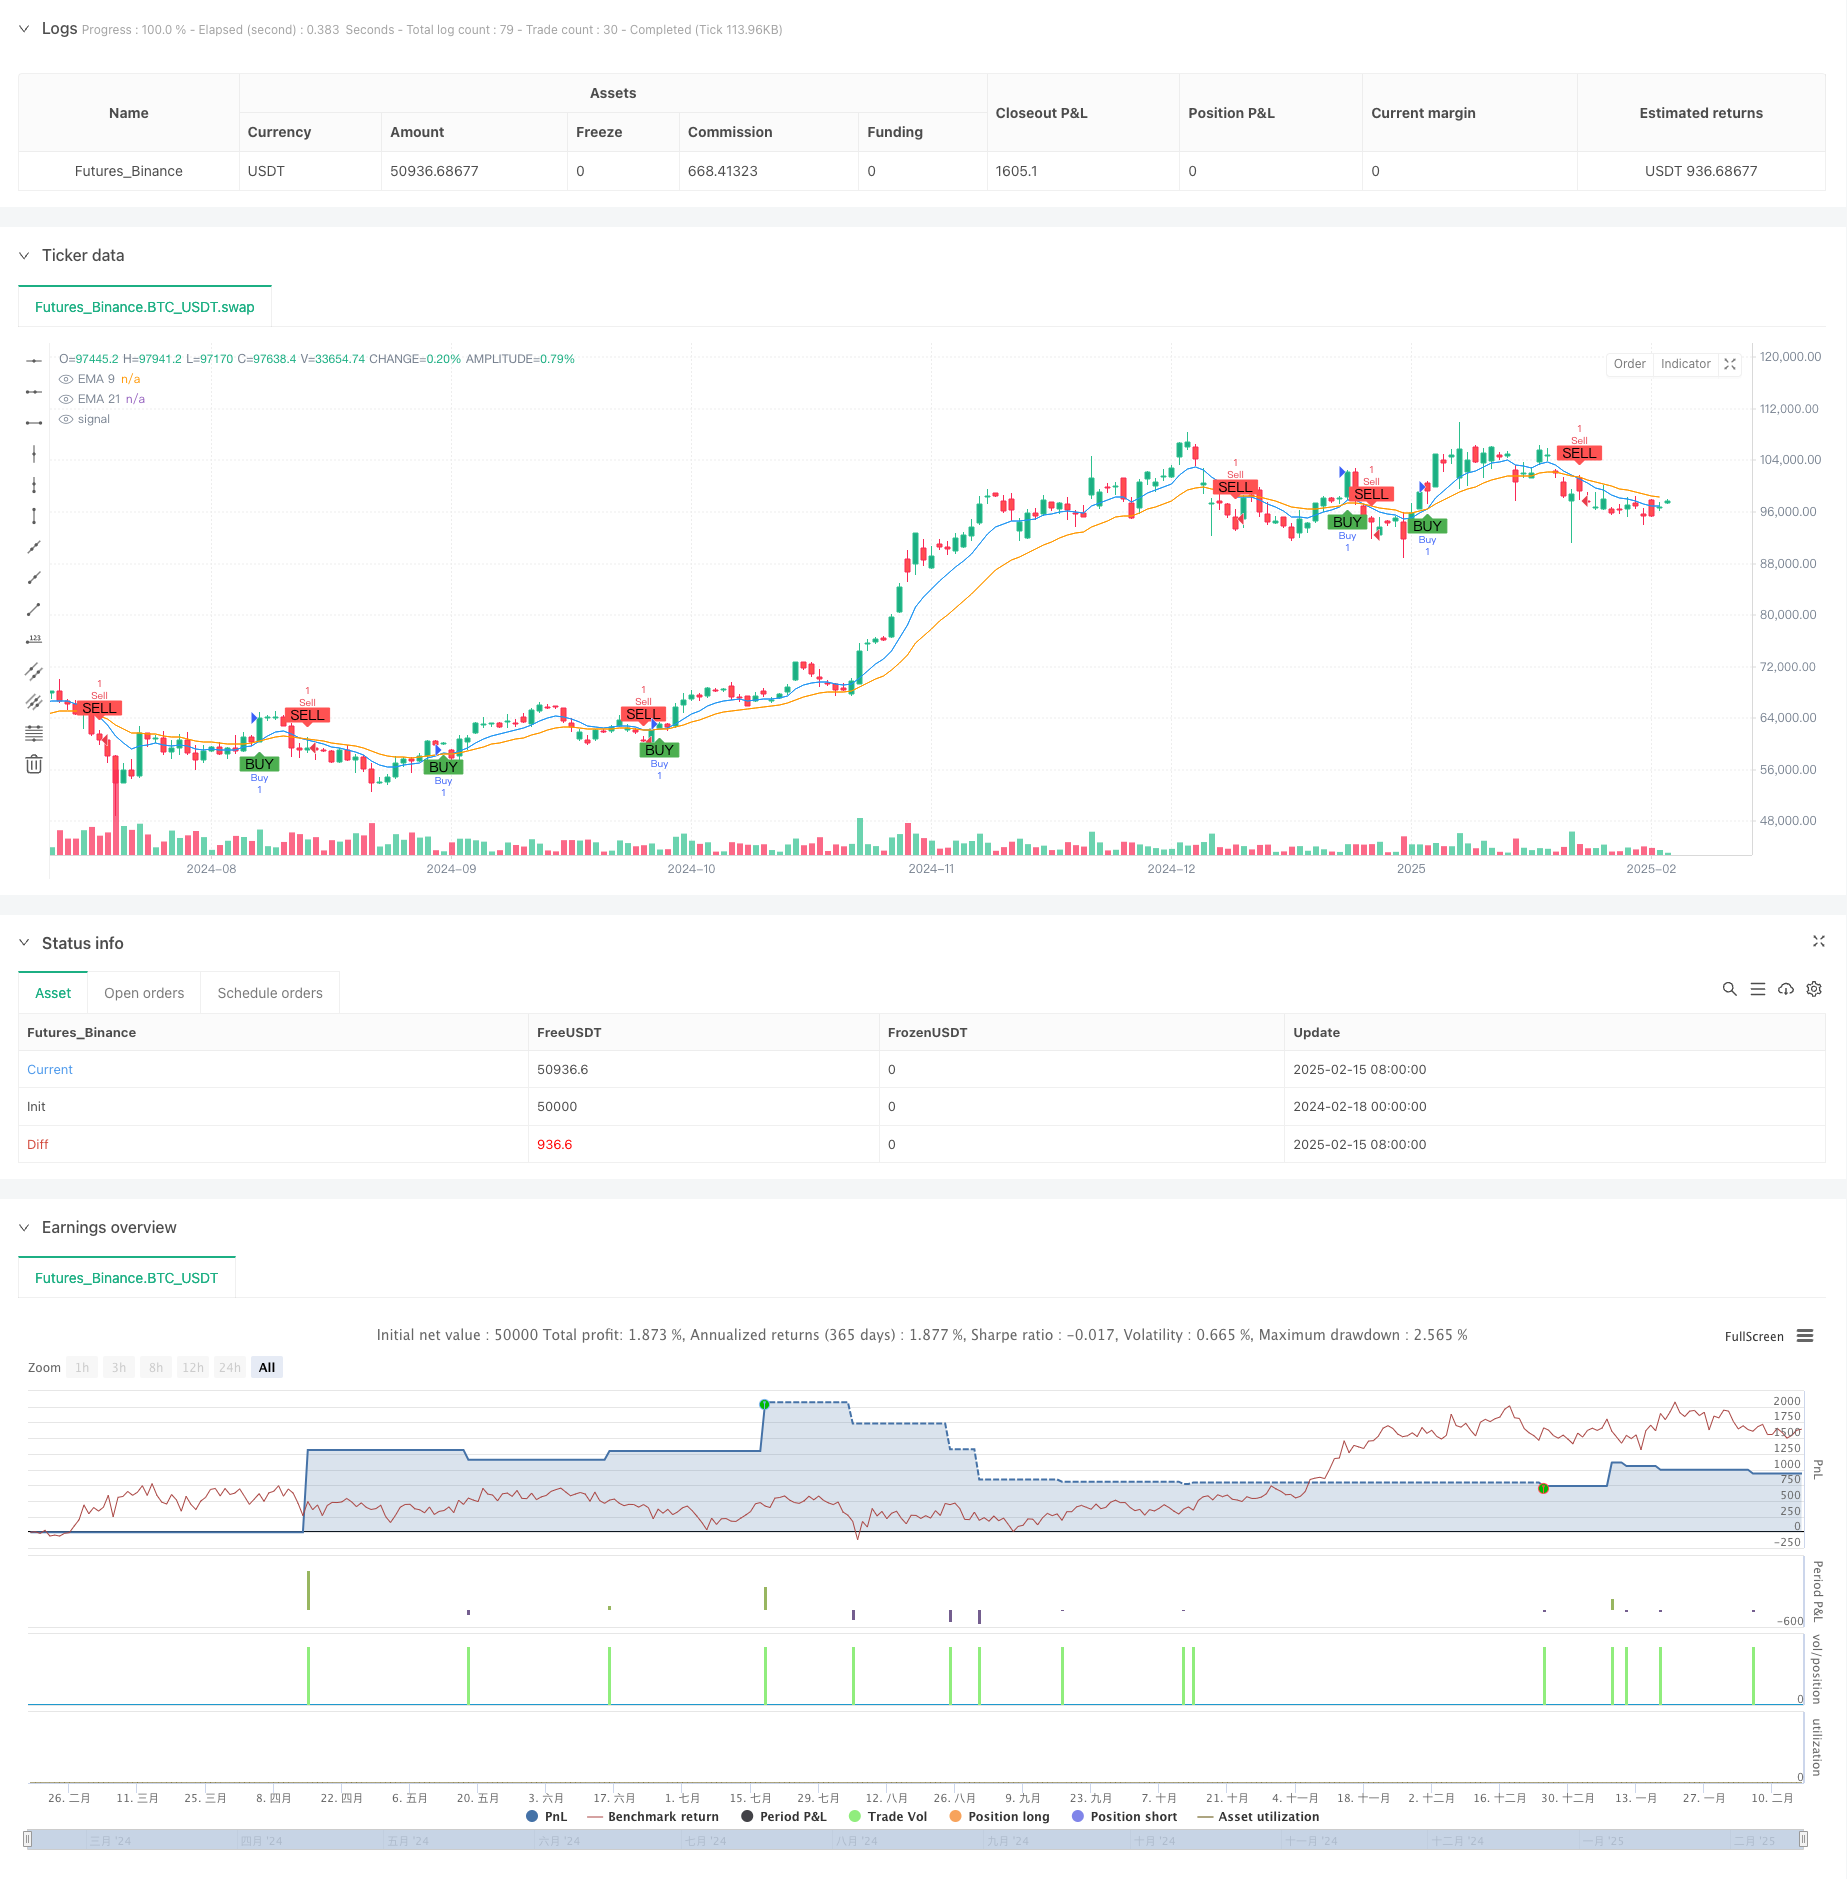
/*backtest
start: 2024-02-18 00:00:00
end: 2025-02-16 08:00:00
period: 1d
basePeriod: 1d
exchanges: [{"eid":"Futures_Binance","currency":"BTC_USDT"}]
*/

// This Pine Script™ code is subject to the terms of the Mozilla Public License 2.0 at https://mozilla.org/MPL/2.0/
// © Lukhi24

//@version=6
strategy("Lukhi EMA Crossover_TWL Strategy" , overlay=true)

// Input Parameters
capital = 15000  // Capital: ₹15,000
risk_per_trade = 1000  // Risk per Trade: ₹1,000
target_per_trade = 5000  // Take Profit per Trade: ₹5,000
lot_size = input.int(1, title="Lot Size")  // Nifty option lot size (adjust as per your instrument)
stop_loss_distance = input.float(25, title="Stop Loss Distance (Points)")  // Fixed stop-loss in points (adjustable)

// EMA Parameters
short_ema_length = input.int(9, title="Short EMA Length")
long_ema_length = input.int(21, title="Long EMA Length")

// RSI Parameters
rsi_length = input.int(14, title="RSI Length")
rsi_overbought = input.float(70, title="RSI Overbought Level")
rsi_oversold = input.float(30, title="RSI Oversold Level")

// Calculations
ema_short = ta.ema(close, short_ema_length)
ema_long = ta.ema(close, long_ema_length)
rsi = ta.rsi(close, rsi_length)

// Buy and Sell Signals
buy_signal = ta.crossover(ema_short, ema_long) and rsi > 50
sell_signal = ta.crossunder(ema_short, ema_long) and rsi < 50

// Plot EMAs on the chart
plot(ema_short, color=color.blue, title="EMA 9")
plot(ema_long, color=color.orange, title="EMA 21")

// Risk Management: Position size based on stop-loss distance
position_size = risk_per_trade / stop_loss_distance

// Stop Loss and Take Profit Levels
long_stop_loss = close - stop_loss_distance
long_take_profit = close + (target_per_trade / position_size)

short_stop_loss = close + stop_loss_distance
short_take_profit = close - (target_per_trade / position_size)

// Strategy Logic: Entry, Stop Loss, and Take Profit
if (buy_signal)
    strategy.entry("Buy", strategy.long, qty=lot_size)
    strategy.exit("Exit Buy", "Buy", stop=long_stop_loss, limit=long_take_profit)

if (sell_signal)
    strategy.entry("Sell", strategy.short, qty=lot_size)
    strategy.exit("Exit Sell", "Sell", stop=short_stop_loss, limit=short_take_profit)

// Track Trade Result and Detect Failures
long_trade_loss = strategy.position_size > 0 and close <= long_stop_loss
short_trade_loss = strategy.position_size < 0 and close >= short_stop_loss

// Plot Buy and Sell signals on the chart
plotshape(buy_signal, location=location.belowbar, color=color.green, style=shape.labelup, title="Buy Signal", text="BUY")
plotshape(sell_signal, location=location.abovebar, color=color.red, style=shape.labeldown, title="Sell Signal", text="SELL")

// Plot Failure Signals
plotshape(long_trade_loss, location=location.belowbar, color=color.red, style=shape.cross, title="Long Trade Failed", text="Failed")
plotshape(short_trade_loss, location=location.abovebar, color=color.red, style=shape.cross, title="Short Trade Failed", text="Failed")