
Overview
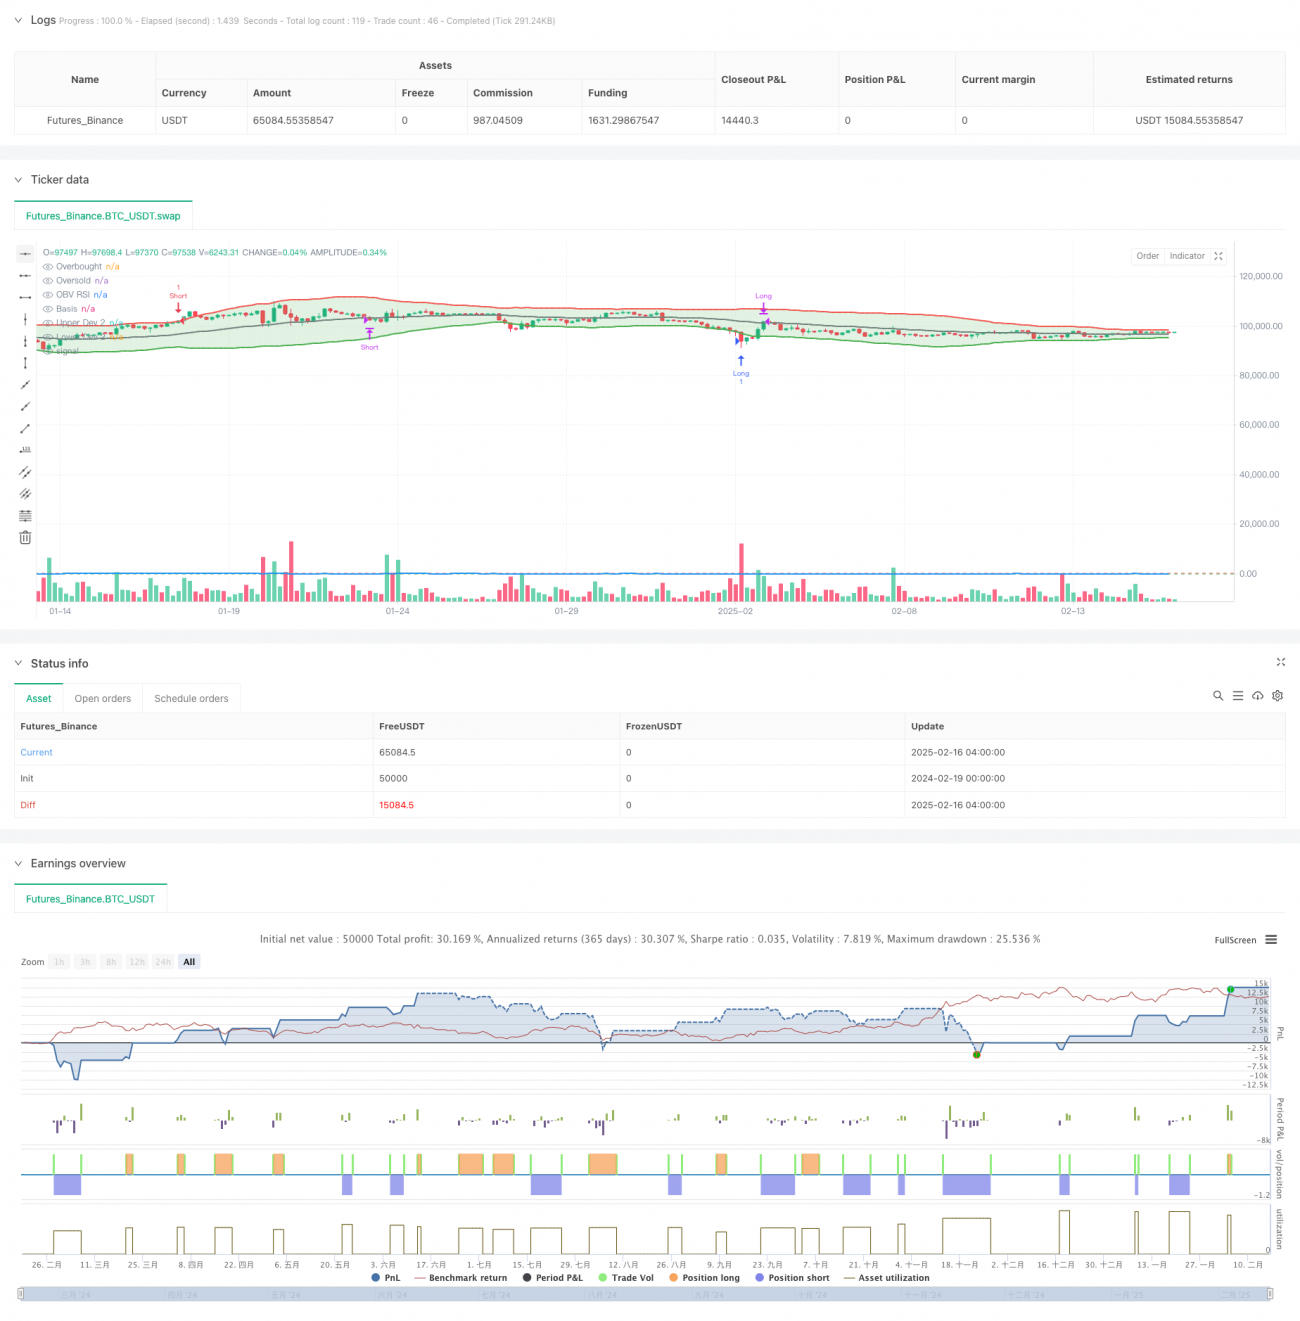
This is a combined mean reversion trading strategy that integrates VWAP (Volume-Weighted Average Price) deviation and OBV (On-Balance Volume) RSI. The strategy monitors price deviations from VWAP and OBV-RSI's overbought/oversold conditions to execute trades during extreme market conditions. Signals are generated when price deviates significantly from VWAP while OBV-RSI shows overbought or oversold conditions, with positions closed when price reverts to VWAP.
Strategy Principles
The strategy is based on two core indicators:
- VWAP Deviation Indicator: Uses a 60-period Weighted Moving Average (WMA) to calculate the VWAP baseline and 2-standard deviation channels. These channels identify extreme price deviations.
- OBV-RSI Indicator: Applies traditional RSI to OBV with a 14-period calculation. OBV accumulates volume to reflect price movement strength, while RSI identifies overbought/oversold conditions.
Entry Conditions:
- Long: When OBV-RSI <= 30 (oversold) and price below lower band
- Short: When OBV-RSI >= 70 (overbought) and price above upper band
Exit Conditions:
- When price reverts to VWAP baseline
- 0.6% stop-loss for risk management
Strategy Advantages
- Multi-dimensional confirmation: Combines price, volume, and momentum indicators for more reliable signals
- Comprehensive risk control: Dual protection with fixed stop-loss and mean reversion exits
- High adaptability: Adjustable parameters for different market conditions
- Clear logic: Explicit trading signals, easy to understand and execute
- Mean reversion characteristics: Capitalizes on market overreaction opportunities
Strategy Risks
- Trend market risk: May generate false signals in strong trending markets
- Slippage risk: Significant slippage possible during high volatility
- False breakout risk: Price may continue moving in extreme direction after signal
- Parameter sensitivity: Different parameter combinations may lead to varying performance
- Liquidity risk: Execution challenges in low liquidity markets
Strategy Optimization Directions
- Dynamic parameter adjustment: Adapt VWAP and RSI parameters based on market volatility
- Market environment filtering: Add trend filters to reduce trading frequency in strong trends
- Profit-taking optimization: Design dynamic profit-taking mechanisms for sustained profitability
- Position management improvement: Dynamically adjust position sizes based on volatility and risk assessment
- Signal confirmation enhancement: Add additional technical indicators or time filters for better signal quality
Summary
This strategy combines VWAP deviation and OBV-RSI indicators to create a robust mean reversion trading system. It seeks trading opportunities in extreme market conditions while protecting capital through multiple risk control mechanisms. Although certain risks exist, continuous optimization and refinement can help maintain stable performance across different market environments. Traders are advised to conduct thorough backtesting and parameter optimization before live trading, adjusting strategy parameters according to specific market characteristics.
- 1