Adaptive Trend Detection Strategy with Dual Envelope EMA System

BULL BEAR EMA SMA RSI SIGNAL Trend
Created on: 2025-02-18 15:06:49 Modified on: 2025-02-18 15:06:49
Copy: 0 Number of hits: 330
avatar of ChaoZhang ChaoZhang
1
Follow
1617
Followers

Adaptive Trend Detection Strategy with Dual Envelope EMA System

Overview

This strategy is an innovative trend detection system based on dual Exponential Moving Average (EMA) envelope calculations. It analyzes multidimensional price characteristics to calculate real-time bull-bear power comparisons, identifying market trend changes and persistence. The strategy’s main feature is its adaptability, allowing dynamic adjustment of signal strength based on market conditions.

Strategy Principles

The core principle relies on complex EMA envelope calculations to measure market forces. Specifically: 1. Constructs upper and lower EMA envelopes using open and close prices 2. Derives bullish and bearish power indicators through mathematical calculations 3. Computes a signal line as a supplementary trend confirmation indicator 4. Generates long signals when bullish power exceeds bearish power, and vice versa

Strategy Advantages

  1. Strong Adaptability - Automatically adjusts sensitivity based on market volatility
  2. Stable Signals - Multiple indicator confirmation reduces false signals
  3. Comprehensive Risk Control - Built-in money management system limits position sizes
  4. Excellent Visualization - Separate panel clearly displays all indicators
  5. Flexible Parameters - Adjustable cycle parameters for different market characteristics

Strategy Risks

  1. Trend Reversal Risk - Potential signal lag in highly volatile markets
  2. Money Management Risk - Requires proper initial capital and trading ratio settings
  3. Market Adaptability Risk - Parameters need adjustment in different market environments
  4. Technical Implementation Risk - Requires stable and accurate calculation processes

Optimization Directions

  1. Add volatility filters to adjust signal sensitivity during high volatility periods
  2. Incorporate volume indicators as confirmation systems
  3. Optimize money management with dynamic position sizing
  4. Add trend strength filters to improve signal quality
  5. Develop adaptive parameter optimization systems

Summary

This is a scientifically-based trend following strategy that effectively captures market trends through advanced technical indicator design and strict risk control. The strategy’s core strengths lie in its adaptability and reliability, maintaining stable performance across different market environments through proper parameter optimization and risk management.
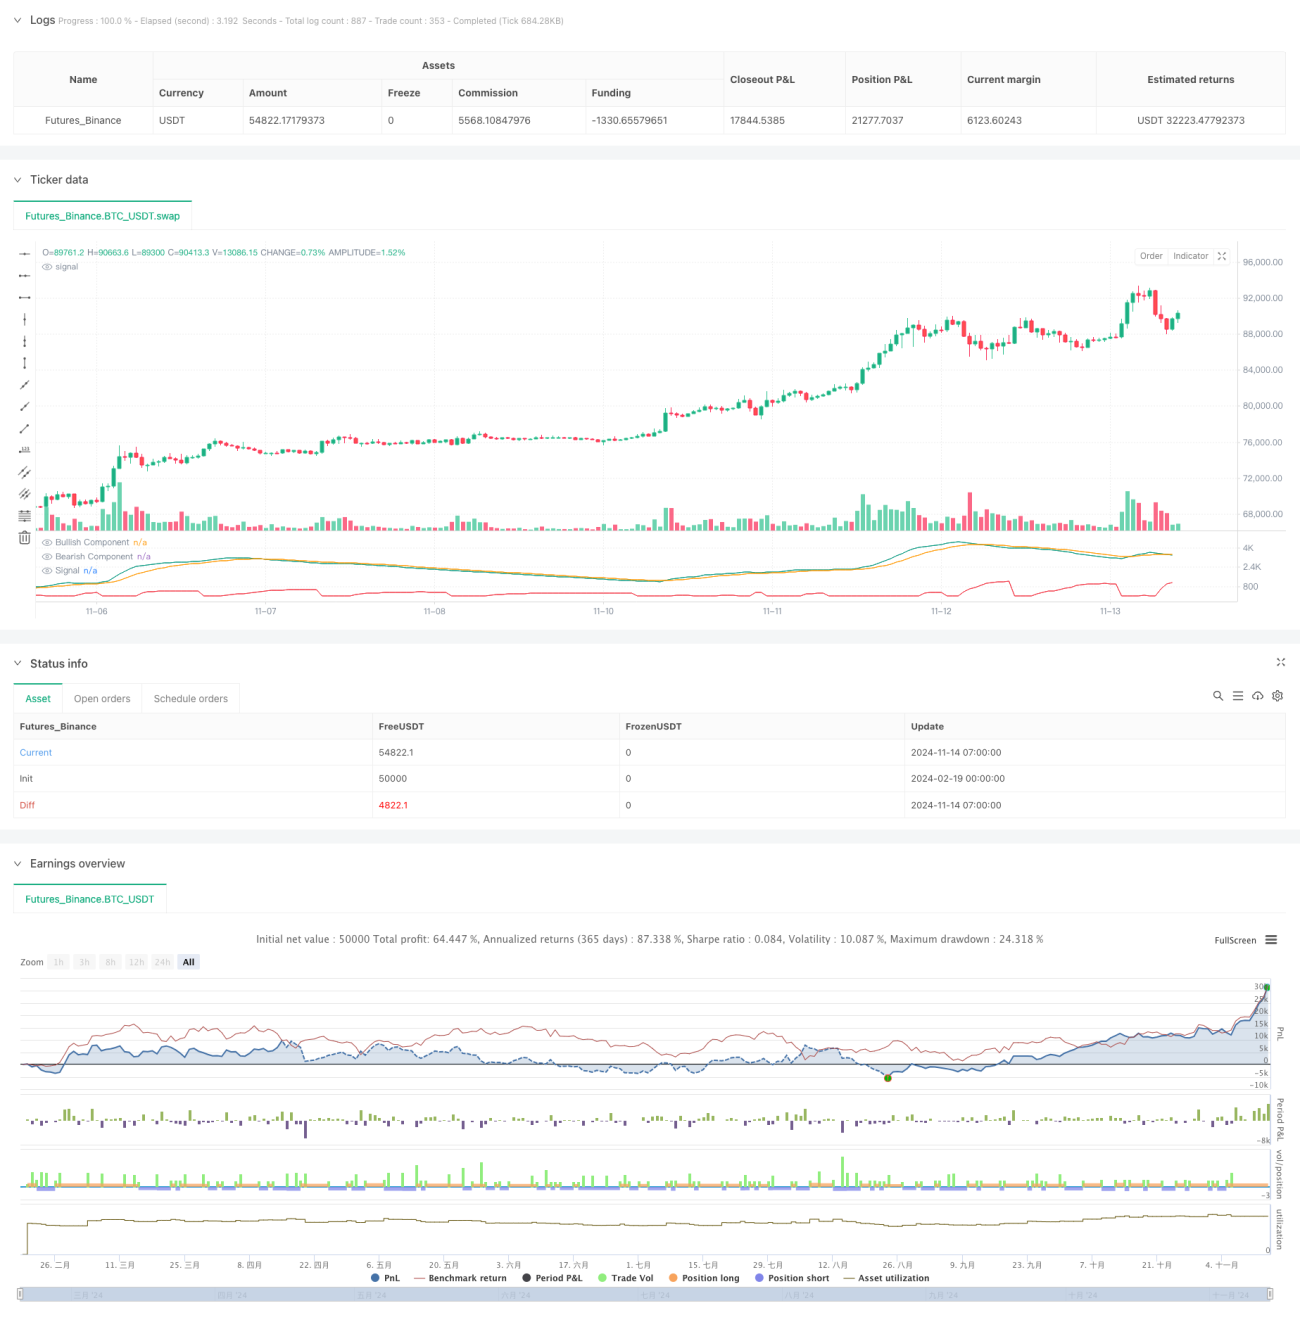
Strategy source code
/*backtest
start: 2024-02-19 00:00:00
end: 2024-11-14 08:00:00
period: 1h
basePeriod: 1h
exchanges: [{"eid":"Futures_Binance","currency":"BTC_USDT"}]
*/

//  This work is licensed under a Attribution-NonCommercial-ShareAlike 4.0 International (CC BY-NC-SA 4.0) 
//  https://creativecommons.org/licenses/by-nc-sa/4.0/
//  © alexgrover
//
//  Original post: 
//  https://alpaca.markets/learn/andean-oscillator-a-new-technical-indicator-based-on-an-online-algorithm-for-trend-analysis/

//@version=5
strategy(title="Andean Oscillator [Strategy]",
     shorttitle="AndeanOsc_Strategy",
     overlay=false,              // Zobraziť sa môže v samostatnom okne
     initial_capital=10000,      // Počiatočný kapitál
     default_qty_type=strategy.percent_of_equity,
     default_qty_value=100,      // Použiť 100% z účtu na jeden obchod
     pyramiding=0)               // Nenavyšovať pozície

//------------------------------------------------------------------------------
//Inputs
//------------------------------------------------------------------------------
length     = input.int(50, "Length")
sig_length = input.int(9, "Signal Length")

//------------------------------------------------------------------------------
//Výpočet Andean Oscillatora
//------------------------------------------------------------------------------
var float alpha = 2.0 / (length + 1)

// Premenné musia byť deklarované ako `var` pre zachovanie stavu
var float up1 = 0.
var float up2 = 0.
var float dn1 = 0.
var float dn2 = 0.

C = close
O = open

// Výpočet EMA obálok
up1 := nz(math.max(C, O, up1[1] - (up1[1] - C) * alpha), C)
up2 := nz(math.max(C * C, O * O, up2[1] - (up2[1] - C * C) * alpha), C * C)

dn1 := nz(math.min(C, O, dn1[1] + (C - dn1[1]) * alpha), C)
dn2 := nz(math.min(C * C, O * O, dn2[1] + (C * C - dn2[1]) * alpha), C * C)

// Býčia zložka a medvedia zložka
bull   = math.sqrt(dn2 - dn1 * dn1)
bear   = math.sqrt(up2 - up1 * up1)

// Signál = EMA z max(bull, bear)
signal = ta.ema(math.max(bull, bear), sig_length)

//------------------------------------------------------------------------------
//Jednoduchá LOGIKA STRATÉGIE (iba demonštrácia)
//------------------------------------------------------------------------------
// Príklad: 
// - Ak je bull > bear, vstúpime do long (býčia sila väčšia ako medvedia)
// - Ak je bear > bull, vstúpime do short (medvedia sila väčšia ako býčia)
//
// S pyramiding=0 sa otvorí vždy iba jedna pozícia – ak príde opačný signál, 
// TradingView zatvorí starú a otvorí novú.

if bull > bear
    strategy.entry("Long", strategy.long, comment="Bull > Bear")

if bear > bull
    strategy.entry("Short", strategy.short, comment="Bear > Bull")

//------------------------------------------------------------------------------
// Plotovanie (na posúdenie v samostatnom paneli)
//------------------------------------------------------------------------------
plot(bull,   "Bullish Component",  color=#089981)
plot(bear,   "Bearish Component",  color=#f23645)
plot(signal, "Signal",             color=#ff9800)