ATR Dynamic Trend Following with Re-entry Trading Strategy

Overview
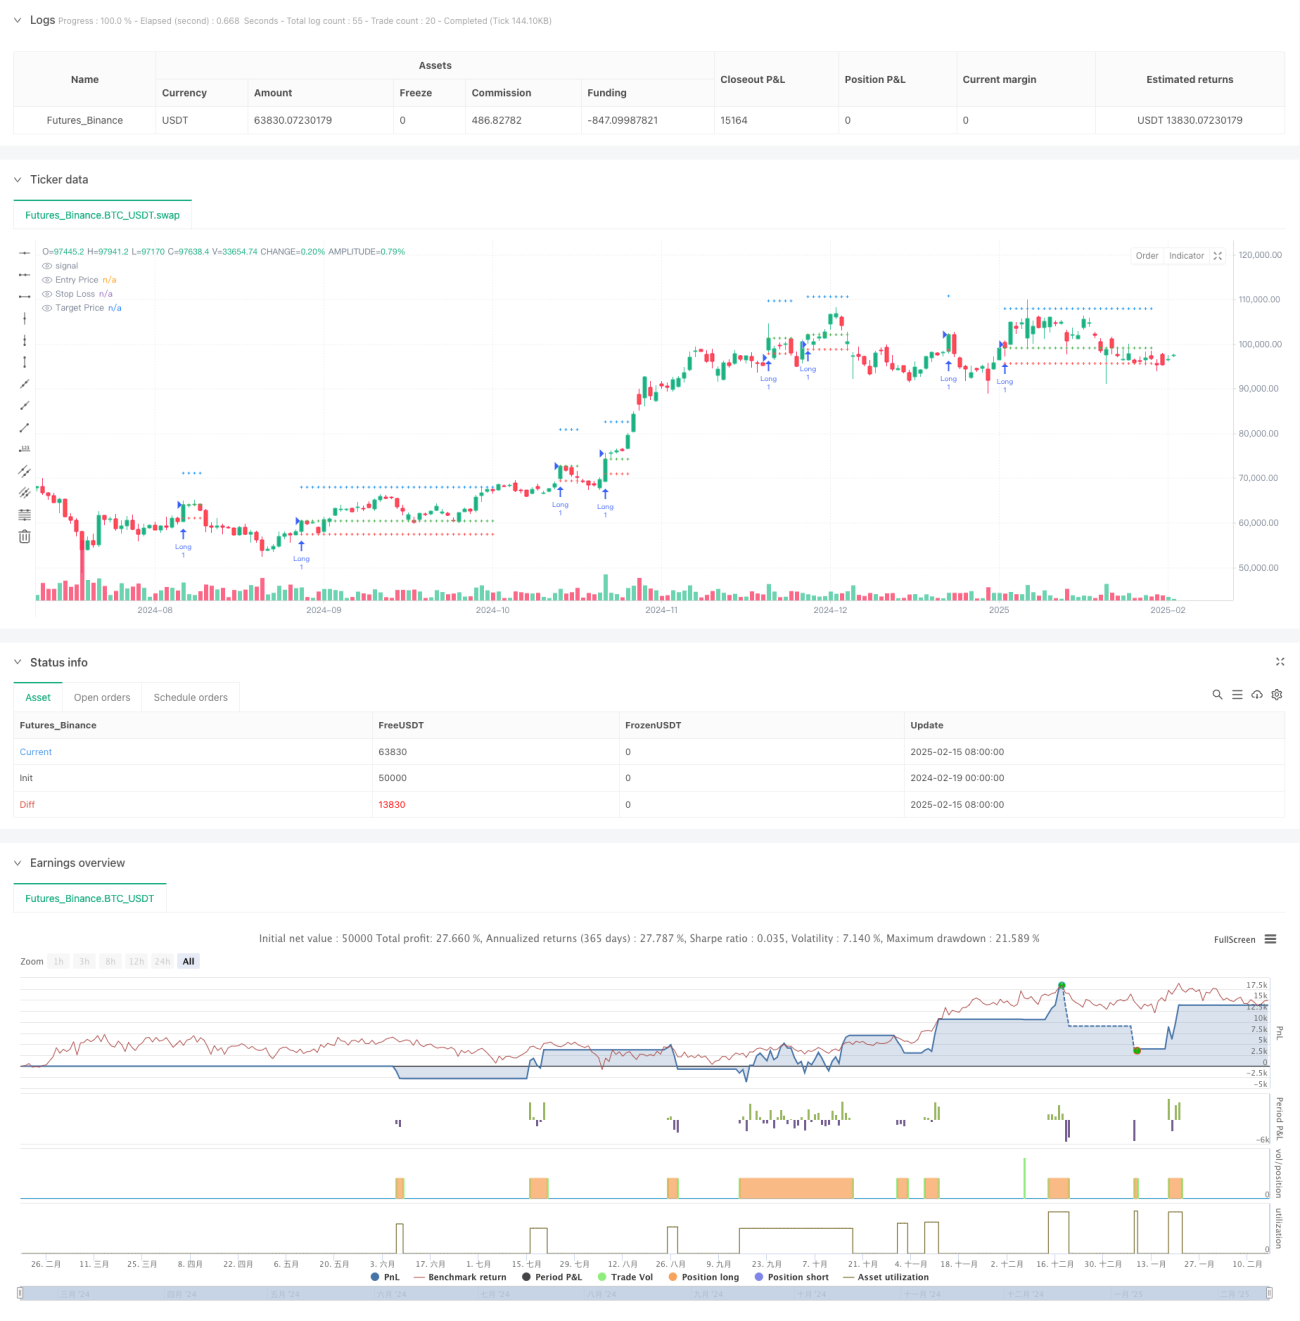
This is a trend-following strategy that dynamically adjusts using ATR, combining moving averages and ATR indicators to determine entry and exit points. The strategy's core feature is using ATR to dynamically adjust moving average bands, entering long positions when price breaks above the upper band, and setting stop-loss and take-profit levels based on ATR multiples. Additionally, the strategy includes an innovative re-entry mechanism allowing new positions when price retraces to the entry point.
Strategy Principles
The strategy operates based on the following key elements:
- Uses ATR-adjusted moving averages as trend indicators, forming dynamic upper and lower bands
- Generates long entry signals when price breaks above the upper band, with entry price at current close
- Sets stop-loss at 2×ATR below entry price
- Sets take-profit at (5+custom multiplier)×ATR above entry price
- Automatically re-enters positions if price retraces to original entry level after stop-loss or take-profit
- Implements 30-bar maximum display limit for optimized chart visualization
Strategy Advantages
- Strong Dynamic Adaptability: ATR-adjusted moving averages self-adapt to market volatility changes
- Scientific Risk Management: Stop-loss and take-profit levels dynamically set based on ATR, matching market volatility characteristics
- Innovative Re-entry Mechanism: Allows re-entry at favorable price levels, increasing profit opportunities
- Excellent Visualization: Provides clear entry, stop-loss, and take-profit line displays for trade monitoring
- Flexible Parameters: Adjustable trend period and take-profit multiplier through input parameters
Strategy Risks
- Trend Reversal Risk: Frequent stop-losses possible in ranging markets
- Re-entry Risk: Consecutive stop-losses possible when re-entering at previous entry points
- Slippage Risk: Actual execution prices may deviate from signal prices during high volatility
- Parameter Sensitivity: Optimal parameters may vary significantly across different market conditions
- Computational Load: Real-time calculation of multiple technical indicators may increase system load
Strategy Optimization Directions
- Implement Market Environment Filters: Add volatility filters to adjust parameters or pause trading during high volatility
- Optimize Re-entry Logic: Consider stricter conditions for re-entry, such as trend confirmation indicators
- Enhance Profit Taking: Implement trailing stops to protect more profits in trending markets
- Add Time Filters: Implement trading time restrictions to avoid low liquidity periods
- Improve Calculation Efficiency: Reduce unnecessary calculations and plotting to enhance strategy performance
Summary
This is a well-designed, logically clear trend-following strategy with good market adaptability through ATR dynamic adjustment. The re-entry mechanism is an innovative feature that can provide additional profit opportunities under favorable market conditions. While there are some risk factors to consider, the suggested optimization directions can further enhance the strategy's stability and profitability. For investors seeking systematic trading methods, this represents a worthwhile basic strategy framework.
- 1