Multi-EMA Trend Following Strategy with RSI-MACD Momentum Validation

Overview
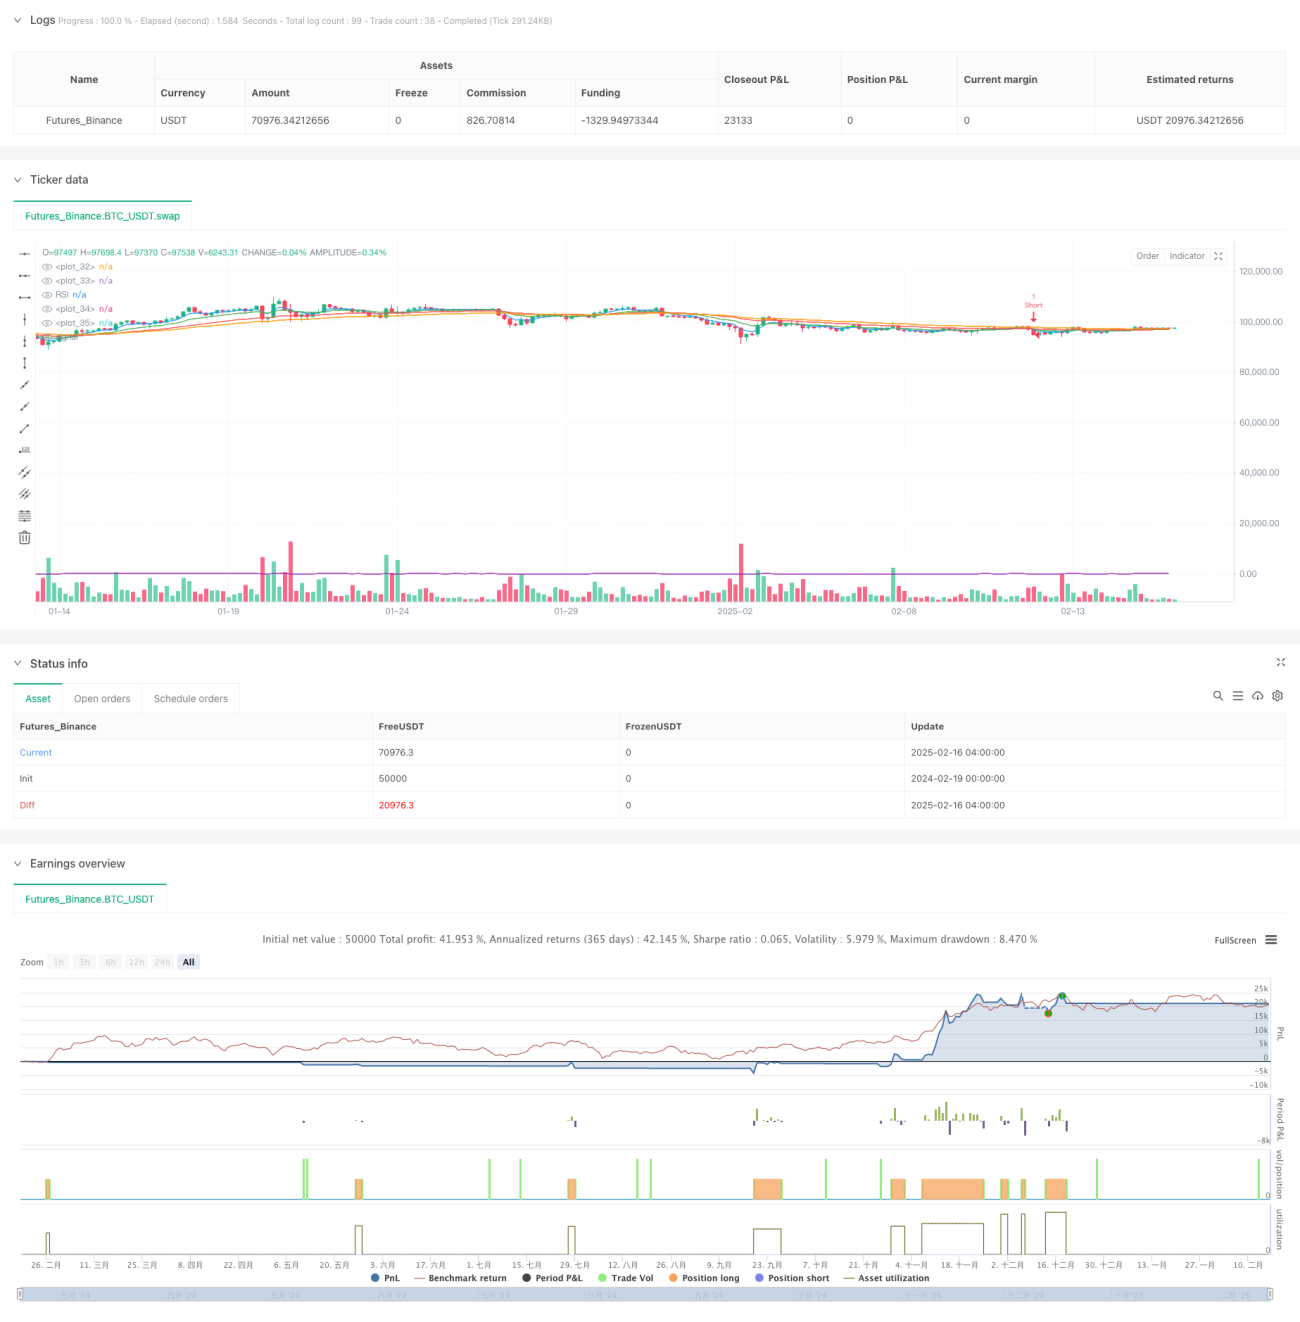
This strategy is a trend-following trading system based on multiple Exponential Moving Averages (EMA), Relative Strength Index (RSI), and Moving Average Convergence Divergence (MACD). It identifies market trends through multiple EMA alignments, validates entry timing with RSI and MACD momentum confirmation, and manages risk and profit using EMA-based stop-loss and take-profit methods.
Strategy Principles
The strategy employs an "EMA Cascade" formation using 5, 14, 34, and 55-period EMAs to determine trend direction. For uptrends, it requires EMA5>EMA14>EMA34>EMA55; the opposite for downtrends. Trade signals are triggered when the MACD line crosses the zero line and RSI is above 50 (for longs) or below 50 (for shorts). Stop-loss is set at the 34-period EMA, with a take-profit target at 3 times the stop-loss distance.
Strategy Advantages
- The combination of multiple technical indicators provides more reliable trading signals, reducing false breakout risks
- EMA cascade formation effectively identifies strong trends, avoiding frequent trading in ranging markets
- RSI and MACD momentum confirmation mechanisms filter out weak trend opportunities
- EMA-based dynamic stop-loss method both protects profits and allows trends to develop fully
- Higher risk-reward ratio (3:1) contributes to favorable long-term performance
Strategy Risks
- In highly volatile markets, multiple EMAs' lag may cause delayed entries or exits
- Strong dependence on trending markets may lead to consecutive losses in ranging conditions
- MACD zero-line crossovers can generate false signals, especially in high volatility periods
- The 3x stop-loss take-profit target might be too aggressive in certain market conditions
- Multiple indicator combinations may reduce trading opportunities, affecting strategy frequency
Optimization Directions
- Consider incorporating volatility indicators (like ATR) for dynamic stop-loss and take-profit adjustments
- Add volume indicators to validate trend effectiveness
- Dynamically adjust EMA periods based on different market conditions
- Consider reducing risk-reward requirements in ranging markets
- Implement market environment filters to pause trading in non-trending conditions
Summary
This is a well-designed trend-following strategy that ensures trading reliability and effective risk control through multiple technical indicators' coordination. While the strategy may underperform in ranging markets, its performance and stability can be further enhanced through the suggested optimizations. For live trading, it's recommended to conduct thorough backtesting and parameter optimization, with specific adjustments based on market characteristics.
- 1