Overview
This strategy is a quantitative trading system that combines the Keltner Channel and Relative Strength Index (RSI). It captures trading opportunities in market volatility through the combination of dynamic price channels and momentum indicators. The strategy uses Exponential Moving Average (EMA) and Average True Range (ATR) to calculate price channels, coupled with RSI for trade signal confirmation, achieving dual filtration of trend following and overbought/oversold conditions.
Strategy Principle
The core logic of the strategy is based on the following key components: 1. Keltner Channel Construction: Uses 20-period EMA as the middle band, 10-period ATR multiplied by 1.5 for upper and lower bands, forming a dynamic price fluctuation range. 2. RSI Application: Uses 14-period RSI calculation, with 70 and 30 as overbought and oversold thresholds. 3. Trade Signal Generation: - Long Entry: Price breaks above lower channel band and RSI is below 30 - Short Entry: Price breaks below upper channel band and RSI is above 70 4. Exit Logic: - Long Exit: Price falls below EMA or RSI rises above 50 - Short Exit: Price rises above EMA or RSI falls below 50
Strategy Advantages
- Multi-dimensional Confirmation: Improves signal reliability through the combination of price breakouts and momentum indicators.
- Dynamic Adaptation: Keltner Channel automatically adjusts range width based on market volatility, adapting to different market environments.
- Risk Control: Uses EMA and RSI neutral levels for exit conditions, helping with timely profit-taking and stop-loss.
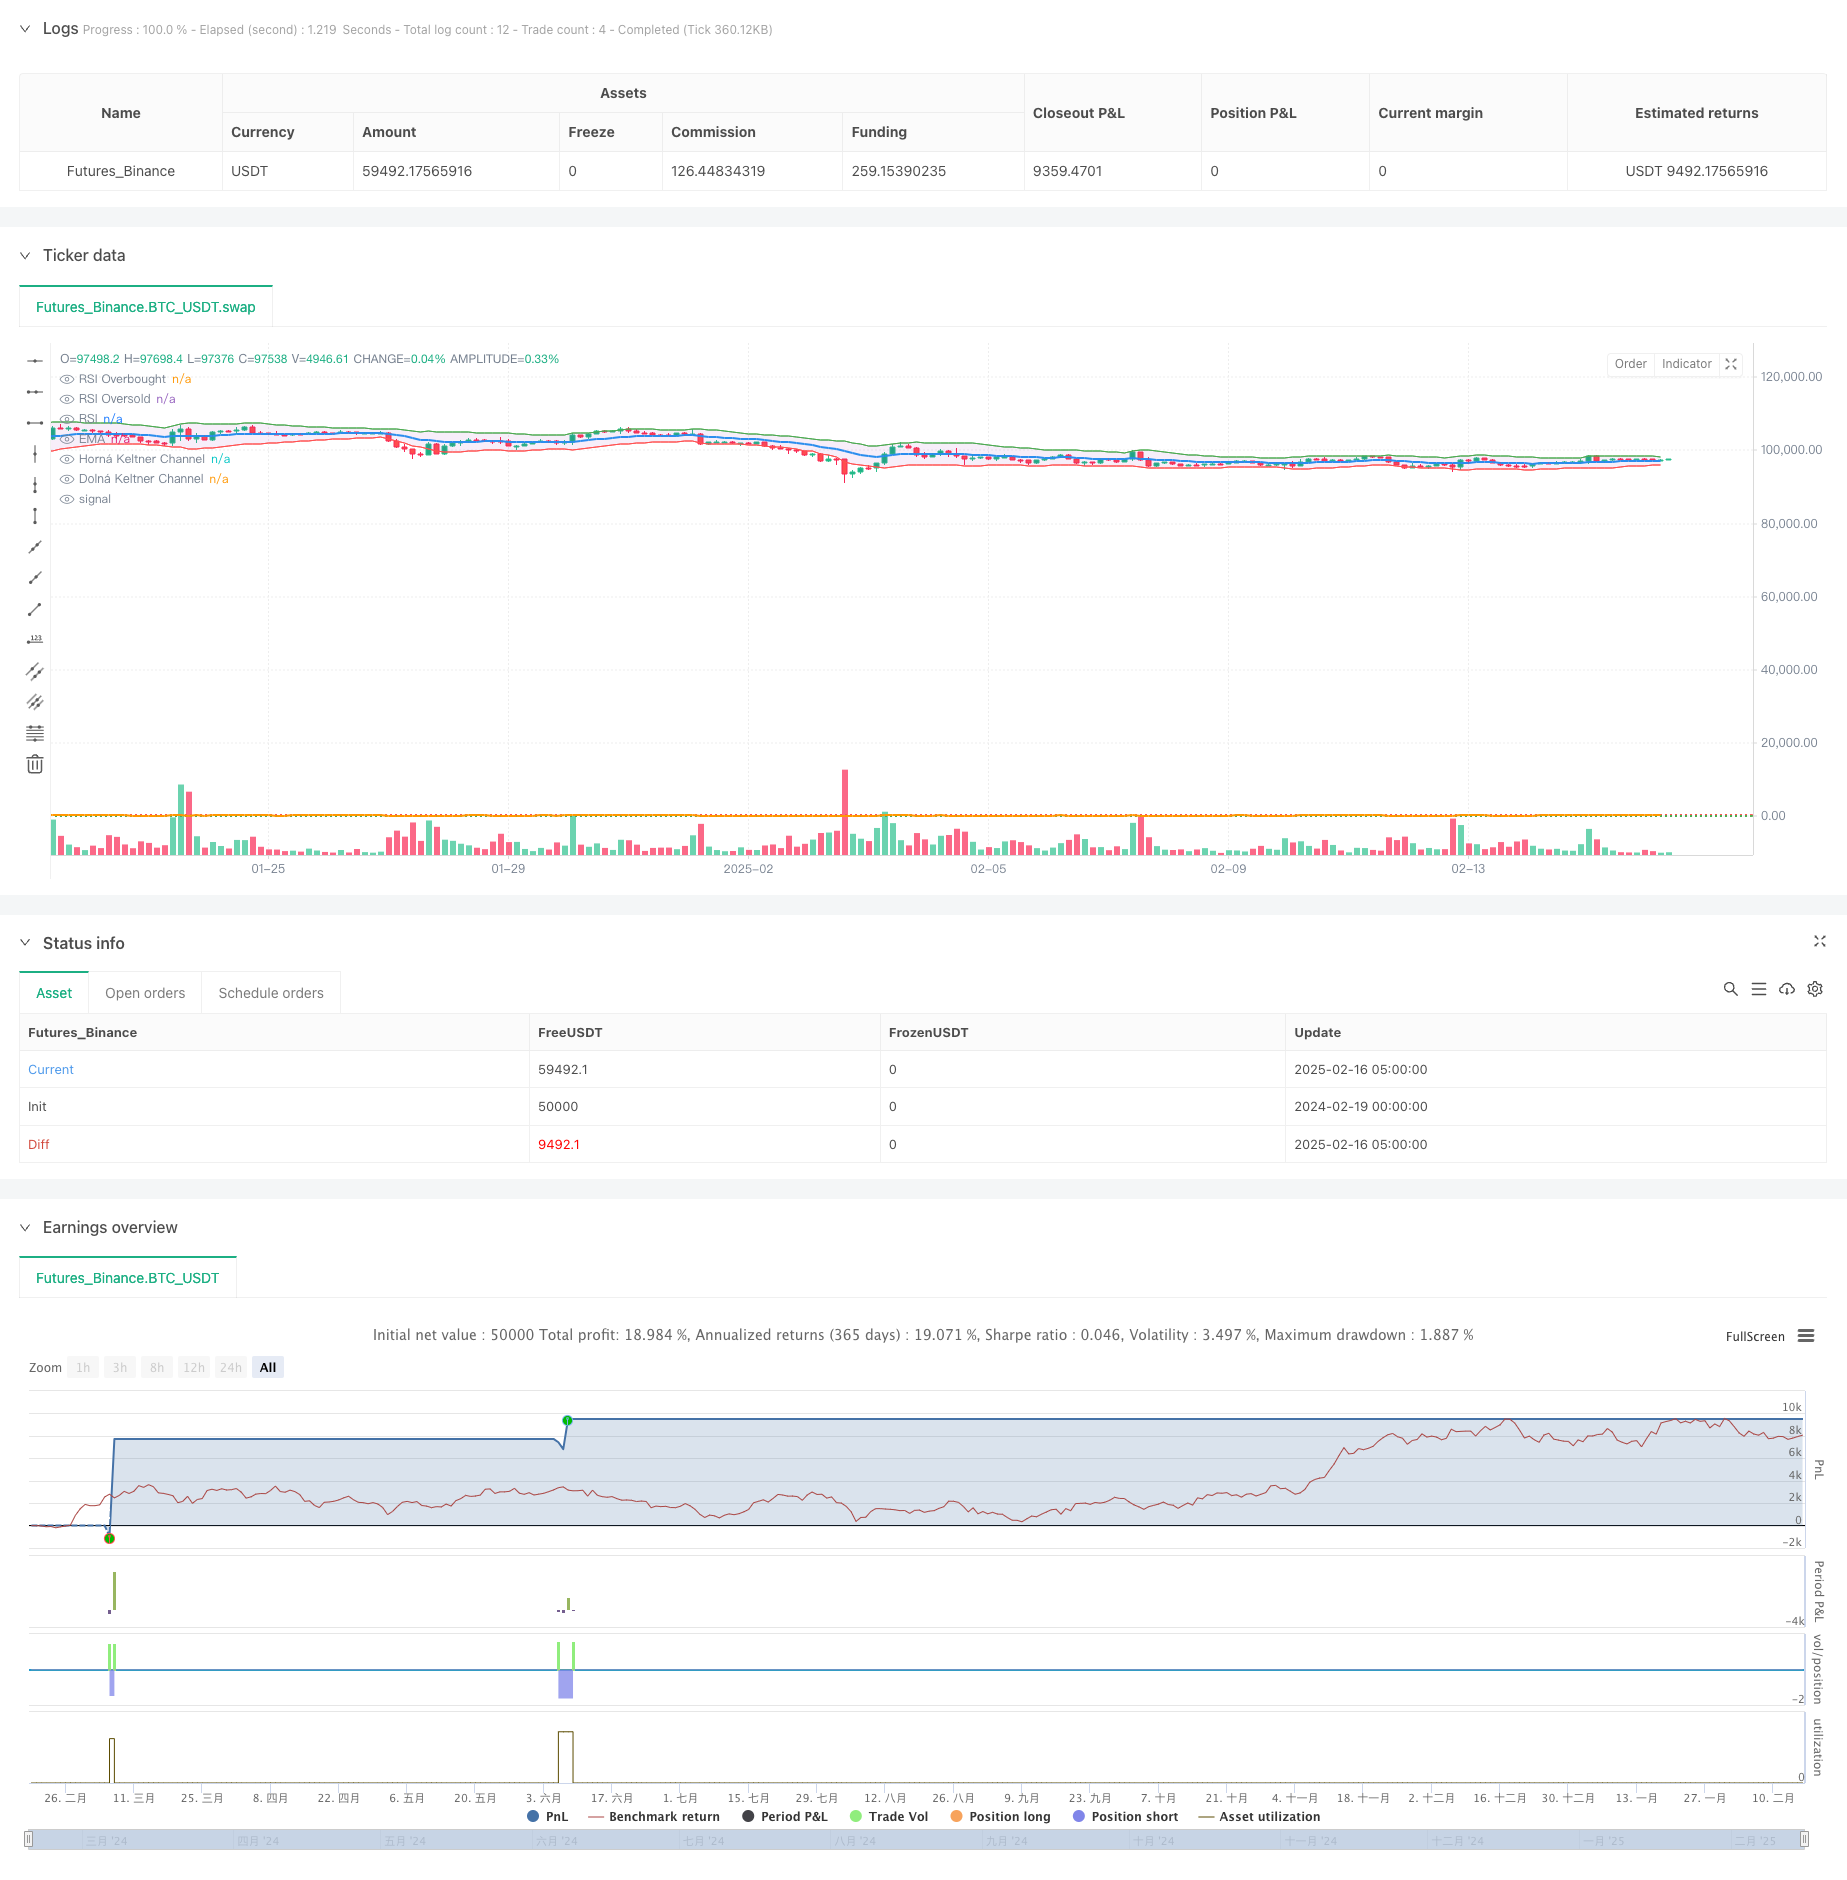
- Visual Support: Strategy provides clear graphical interface including channels, RSI levels, and trade signal markers.
Strategy Risks
- False Breakout Risk: Frequent false breakout signals may occur in ranging markets.
- Lag Issues: Both EMA and RSI have inherent lag, potentially causing delayed entry or exit timing.
- Parameter Sensitivity: Strategy effectiveness is sensitive to parameter settings, different market environments may require parameter adjustments.
- Trend Dependency: Strategy may underperform in markets without clear trends.
Strategy Optimization Directions
- Parameter Adaptation: Introduce adaptive mechanisms to dynamically adjust channel parameters and RSI thresholds based on market volatility.
- Signal Filtering: Add auxiliary indicators like volume and volatility to improve signal quality.
- Position Management: Introduce dynamic position management mechanisms to adjust holdings based on signal strength and market risk.
- Market Environment Recognition: Add market environment assessment module to use different parameter combinations in different market states.
Summary
This strategy builds a relatively complete trading system by combining price channels and momentum indicators. Its strengths lie in multi-dimensional signal confirmation and dynamic adaptation capability, but attention must be paid to risks such as false breakouts and parameter sensitivity. Through further optimization of parameter adaptability and signal filtering mechanisms, the strategy’s stability and reliability can be improved. The strategy is suitable for application in markets with clear trends and is a good choice for traders looking to capture market momentum through technical indicators.
/*backtest
start: 2024-02-19 00:00:00
end: 2025-02-16 08:00:00
period: 3h
basePeriod: 3h
exchanges: [{"eid":"Futures_Binance","currency":"BTC_USDT"}]
*/

//@version=6
strategy("Keltner Channel + RSI Stratégiia", overlay=true, default_qty_type=strategy.percent_of_equity, default_qty_value=200)

// Parametre Keltner Channel
ema_length = input.int(20, title="EMA Perióda")
atr_length = input.int(10, title="ATR Perióda")
multiplier = input.float(1.5, title="ATR Multiplikátor")

// Výpočet Keltner Channel
ema = ta.ema(close, ema_length)
atr = ta.atr(atr_length)
upper_kc = ema + (multiplier * atr)
lower_kc = ema - (multiplier * atr)

// Parametre RSI
rsi_length = input.int(14, title="RSI Perióda")
rsi_overbought = input.int(70, title="RSI Prekúpenosť")
rsi_oversold = input.int(30, title="RSI Prepredanosť")

// Výpočet RSI
rsi = ta.rsi(close, rsi_length)

// Obchodné podmienky

// Nákupná podmienka: Cena prechádza nad dolnou Keltner Channel a RSI je pod prepredanosťou
long_condition = ta.crossover(close, lower_kc) and (rsi < rsi_oversold)

// Predajná podmienka: Cena prechádza pod hornou Keltner Channel a RSI je nad prekúpenosťou
short_condition = ta.crossunder(close, upper_kc) and (rsi > rsi_overbought)

// Uzatváranie pozícií
close_long_condition = ta.crossunder(close, ema) or (rsi > 50)
close_short_condition = ta.crossover(close, ema) or (rsi < 50)

// Vstupy do pozícií
if (long_condition)
    strategy.entry("Long", strategy.long)

if (short_condition)
    strategy.entry("Short", strategy.short)

// Uzatváranie pozícií
if (close_long_condition)
    strategy.close("Long")

if (close_short_condition)
    strategy.close("Short")

// Vizualizácia indikátorov

// Keltner Channel
plot_ema = plot(ema, title="EMA", color=color.blue, linewidth=2)
plot_upper = plot(upper_kc, title="Horná Keltner Channel", color=color.green, linewidth=1)
plot_lower = plot(lower_kc, title="Dolná Keltner Channel", color=color.red, linewidth=1)
fill(plot_upper, plot_lower, color=color.new(color.purple, 90), title="Keltner Channel Fill")  // Nastavenie transparentnosti priamo v farbe

// RSI
hline_overbought = hline(rsi_overbought, "RSI Overbought", color=color.red, linestyle=hline.style_dotted)
hline_oversold = hline(rsi_oversold, "RSI Oversold", color=color.green, linestyle=hline.style_dotted)
plot_rsi = plot(rsi, title="RSI", color=color.orange, linewidth=2, offset=0)

// Šípky pre signály
plotshape(series=long_condition, location=location.belowbar, color=color.green, style=shape.labelup, title="Nákupný Signál", text="BUY")
plotshape(series=short_condition, location=location.abovebar, color=color.red, style=shape.labeldown, title="Predajný Signál", text="SELL")