
This strategy is a quantitative trading system based on linear regression channels and Heikin-Ashi candlesticks, combined with dynamic take-profit and stop-loss mechanisms, specifically designed to capture rapid market movements.
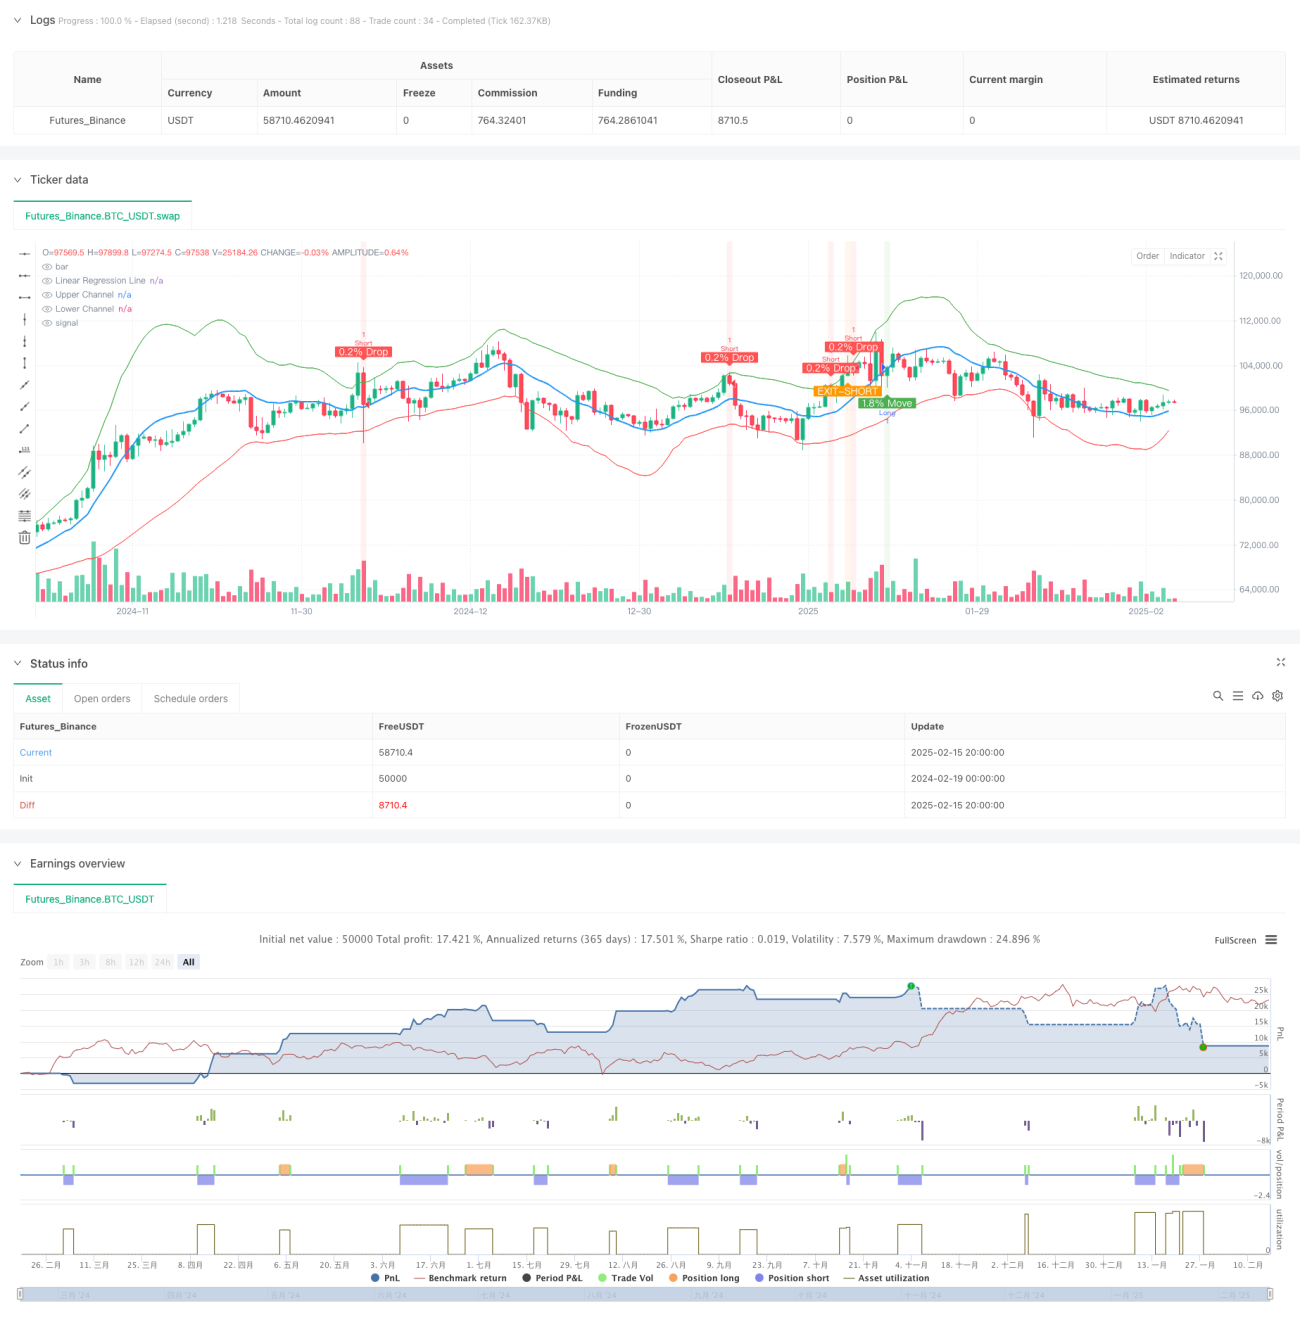
The strategy uses linear regression channels as the main trading framework, identifying potential trading opportunities by monitoring price movements within the channel. Long signals are generated when the price breaks below the channel and shows a rise of more than 1.8%, while short signals occur when the price breaks above the channel and shows a drop of more than 0.2%. The strategy also integrates a dynamic exit system based on Heikin-Ashi candlesticks, along with 10% take-profit and 5% stop-loss risk management mechanisms.
The core of the strategy is based on a 30-period linear regression calculation, with channel width set at 2 times the standard deviation. Entry signals are based on the following conditions: 1. Long entries require a price break below the channel followed by a 1.8% rise, with no more than 5% increase within 2 hours 2. Short entries require a price break above the channel followed by a 0.2% drop 3. Uses 3-minute timeframe Heikin-Ashi candlesticks for exit timing 4. Implements 10% take-profit and 5% stop-loss for risk control
This strategy provides traders with a relatively complete trading system by combining linear regression channels with price breakouts. Its strength lies in the integration of multiple technical indicators and risk control measures, but it still requires optimization and adjustment based on actual market conditions. Thorough backtesting and parameter optimization are recommended before live trading.
/*backtest
start: 2024-02-19 00:00:00
end: 2025-02-16 08:00:00
period: 12h
basePeriod: 12h
exchanges: [{"eid":"Futures_Binance","currency":"BTC_USDT"}]
*/
//@version=6
strategy('STRATEGY WITH SL', overlay=true)
// Parameters for Linear Regression
length = input.int(30, title='Linear Regression Length')
mult = input.float(2.0, title='Channel Multiplier', step=0.1)
// Calculate Linear Regression
regression_line = ta.linreg(close, length, 0)
// Calculate Standard Deviation
stddev = ta.stdev(close, length)
// Upper and Lower Channel Boundaries
upper_channel = regression_line + mult * stddev
lower_channel = regression_line - mult * stddev
// Plot the Linear Regression and Channel
plot(regression_line, color=color.blue, linewidth=2, title='Linear Regression Line')
plot(upper_channel, color=color.green, linewidth=1, title='Upper Channel')
plot(lower_channel, color=color.red, linewidth=1, title='Lower Channel')
// Parameters for Price Move Check (Indicator 1: 1.8% Move)
threshold_move = 1.8
large_threshold_move = 5.0
timeframe_for_large_move = 120
// Calculate the percentage change over the last 3 minutes
priceChange = (close - close[3]) / close[3] * 100
// Calculate the percentage change over the last 2 hours (120 minutes)
priceChange2Hour = (close - close[120]) / close[120] * 100
// Condition for a price move greater than 1.8%
isPriceUp = priceChange > threshold_move
// Condition for price move greater than 5% in 2 hours (no alert if true)
isLargePriceMove = priceChange2Hour > large_threshold_move
// Parameters for Price Drop Check (Indicator 2: 0.2% Drop)
threshold_drop = 0.2 / 100 // 0.2% threshold
// Get the price 3 minutes ago
price_3min_ago = request.security(syminfo.tickerid, '3', close[1])
// Calculate the percentage drop over the last 3 minutes
price_drop = (close - price_3min_ago) / price_3min_ago
// Condition for a 0.2% drop
drop_condition = price_drop <= -threshold_drop
// Track whether the price has crossed the upper or lower Linear Regression channel
var bool lower_crossed = false
var bool upper_crossed = false
var bool move_after_cross = false
var bool alert_sent = false
// Reset flags when price crosses channels
if (close < lower_channel)
lower_crossed := true
move_after_cross := false
if (close > upper_channel)
upper_crossed := true
alert_sent := false
// Combine both conditions for price crossing lower and upper channels and move/drop conditions
final_condition_long = lower_crossed and isPriceUp and not move_after_cross and not isLargePriceMove
final_condition_short = upper_crossed and drop_condition and not alert_sent
// Set flags when conditions are met
if (final_condition_long)
move_after_cross := true
if (final_condition_short)
alert_sent := true
// Heikin-Ashi calculation for dynamic timeframe (3-minute)
heikin_open = (open + close) / 2
heikin_close = (open + high + low + close) / 4
heikin_high = math.max(high, math.max(heikin_open, heikin_close))
heikin_low = math.min(low, math.min(heikin_open, heikin_close))
// Conditions for EXIT signals based on Heikin-Ashi candle body
exit_long_condition = (heikin_open > lower_channel and heikin_close < lower_channel) or (heikin_open < lower_channel and heikin_close > lower_channel)
exit_short_condition = heikin_open < upper_channel and heikin_close > upper_channel
// Strategy logic: Enter long or short based on the combined conditions
// Long Entry Condition
if (final_condition_long)
strategy.entry('Long', strategy.long)
// Short Entry Condition
if (final_condition_short)
strategy.entry('Short', strategy.short)
// Exit Conditions (EXIT-LONG and EXIT-SHORT)
if (exit_long_condition)
strategy.close('Long')
if (exit_short_condition)
strategy.close('Short')
// Take Profit and Stop Loss
take_profit = 10 / 100 // 10% Take Profit
stop_loss = 5 / 100 // 5% Stop Loss
// Calculate Take Profit and Stop Loss levels based on entry price
long_take_profit = strategy.position_avg_price * (1 + take_profit)
long_stop_loss = strategy.position_avg_price * (1 - stop_loss)
short_take_profit = strategy.position_avg_price * (1 - take_profit)
short_stop_loss = strategy.position_avg_price * (1 + stop_loss)
// Apply Take Profit and Stop Loss for Long and Short positions
strategy.exit('Take Profit/Stop Loss Long', from_entry='Long', limit=long_take_profit, stop=long_stop_loss)
strategy.exit('Take Profit/Stop Loss Short', from_entry='Short', limit=short_take_profit, stop=short_stop_loss)
// Plot background color when the conditions are met (for visual aid)
bgcolor(final_condition_long ? color.new(color.green, 90) : na, title='Price Move Alert After Lower Channel Crossed')
bgcolor(final_condition_short ? color.new(color.red, 90) : na, title='Price Drop Alert After Upper Channel Crossed')
bgcolor(exit_long_condition ? color.new(color.blue, 90) : na, title='EXIT-LONG Alert')
bgcolor(exit_short_condition ? color.new(color.orange, 90) : na, title='EXIT-SHORT Alert')
// Plot shapes when conditions are met
plotshape(final_condition_long, style=shape.labelup, location=location.belowbar, color=color.green, text='1.8% Move', textcolor=color.white, size=size.small)
plotshape(final_condition_short, style=shape.labeldown, location=location.abovebar, color=color.red, text='0.2% Drop', textcolor=color.white, size=size.small)
plotshape(exit_long_condition, style=shape.labeldown, location=location.abovebar, color=color.purple, text='EXIT-LONG', textcolor=color.white, size=size.small)
plotshape(exit_short_condition, style=shape.labelup, location=location.belowbar, color=color.orange, text='EXIT-SHORT', textcolor=color.white, size=size.small)
// Alert conditions for price moves and exits
alertcondition(final_condition_long, title="Price Move > 1.8% After Lower LR Channel Cross", message="Price crossed the lower Linear Regression Channel and moved more than 1.8% in the last 3 minutes!")
alertcondition(final_condition_short, title="Price Drop > 0.2% After Upper LR Channel Cross", message="Price crossed the upper Linear Regression Channel and dropped more than 0.2% in the last 3 minutes!")
alertcondition(exit_long_condition, title="EXIT-LONG: Heikin-Ashi Candle Body Crossing Lower LR Channel", message="The body of a 3-minute Heikin-Ashi candle is crossing outside the lower Linear Regression Channel.")
alertcondition(exit_short_condition, title="EXIT-SHORT: Heikin-Ashi Candle Body Crossing Upper LR Channel", message="The body of a 3-minute Heikin-Ashi candle is crossing outside the upper Linear Regression Channel.")