
Overview
This strategy is a trend-following and momentum trading system based on multiple technical indicators. It combines Bollinger Bands (BB), Relative Strength Index (RSI), and On-Balance Volume (OBV) to identify market trends and trading opportunities by analyzing price movements, momentum, and trading volume. The strategy adopts a medium to long-term holding approach, entering long positions when the market shows a clear upward trend with strong momentum and exiting when the price breaks below the lower Bollinger Band.
Strategy Principles
The core logic of the strategy is based on three aspects:
- Using Bollinger Bands (BB) to determine price trends - When price is above the middle band, it confirms an upward trend. BB parameters are set to 20-day moving average and 2 standard deviations.
- Using Relative Strength Index (RSI) to confirm price momentum - RSI above 50 indicates upward momentum. RSI parameter is set to 14 days.
- Using On-Balance Volume (OBV) to verify volume support - Rising 10-day exponential moving average of OBV shows volume confirms price increases.
Entry signals require simultaneous satisfaction of: price above BB middle band, RSI above 50, and upward OBV trend.
Exit signal is: price breaking below the lower BB band.
Strategy Advantages
- Multiple technical indicators cross-validation improves signal reliability
- Combines price, momentum, and volume analysis
- Trend-following approach captures major market moves
- Clear exit conditions effectively control drawdown risk
- Reasonable indicator parameters avoid over-optimization
Strategy Risks
- Potential losses from frequent trading in choppy markets
- Significant drawdowns possible during trend reversals
- Slippage losses in sharp decline scenarios
- Volume indicators may be ineffective in certain markets
- Fixed parameters may not adapt to all market conditions
Strategy Optimization Directions
- Add market environment classification for different parameter sets
- Implement stop-loss mechanisms to control single trade risk
- Optimize exit mechanism to lock in partial profits
- Add volume filters to avoid false breakouts
- Incorporate volatility adaptation for dynamic parameter adjustment
Summary
This strategy is a robust trend-following system that effectively captures market trends through the coordinated use of multiple technical indicators. The strategy logic is clear, with reasonable parameter settings and good practicality. Through the suggested optimization directions, the strategy's stability and profitability can be further improved. When applying to live trading, it is recommended to make appropriate adjustments based on specific market characteristics and capital scale.
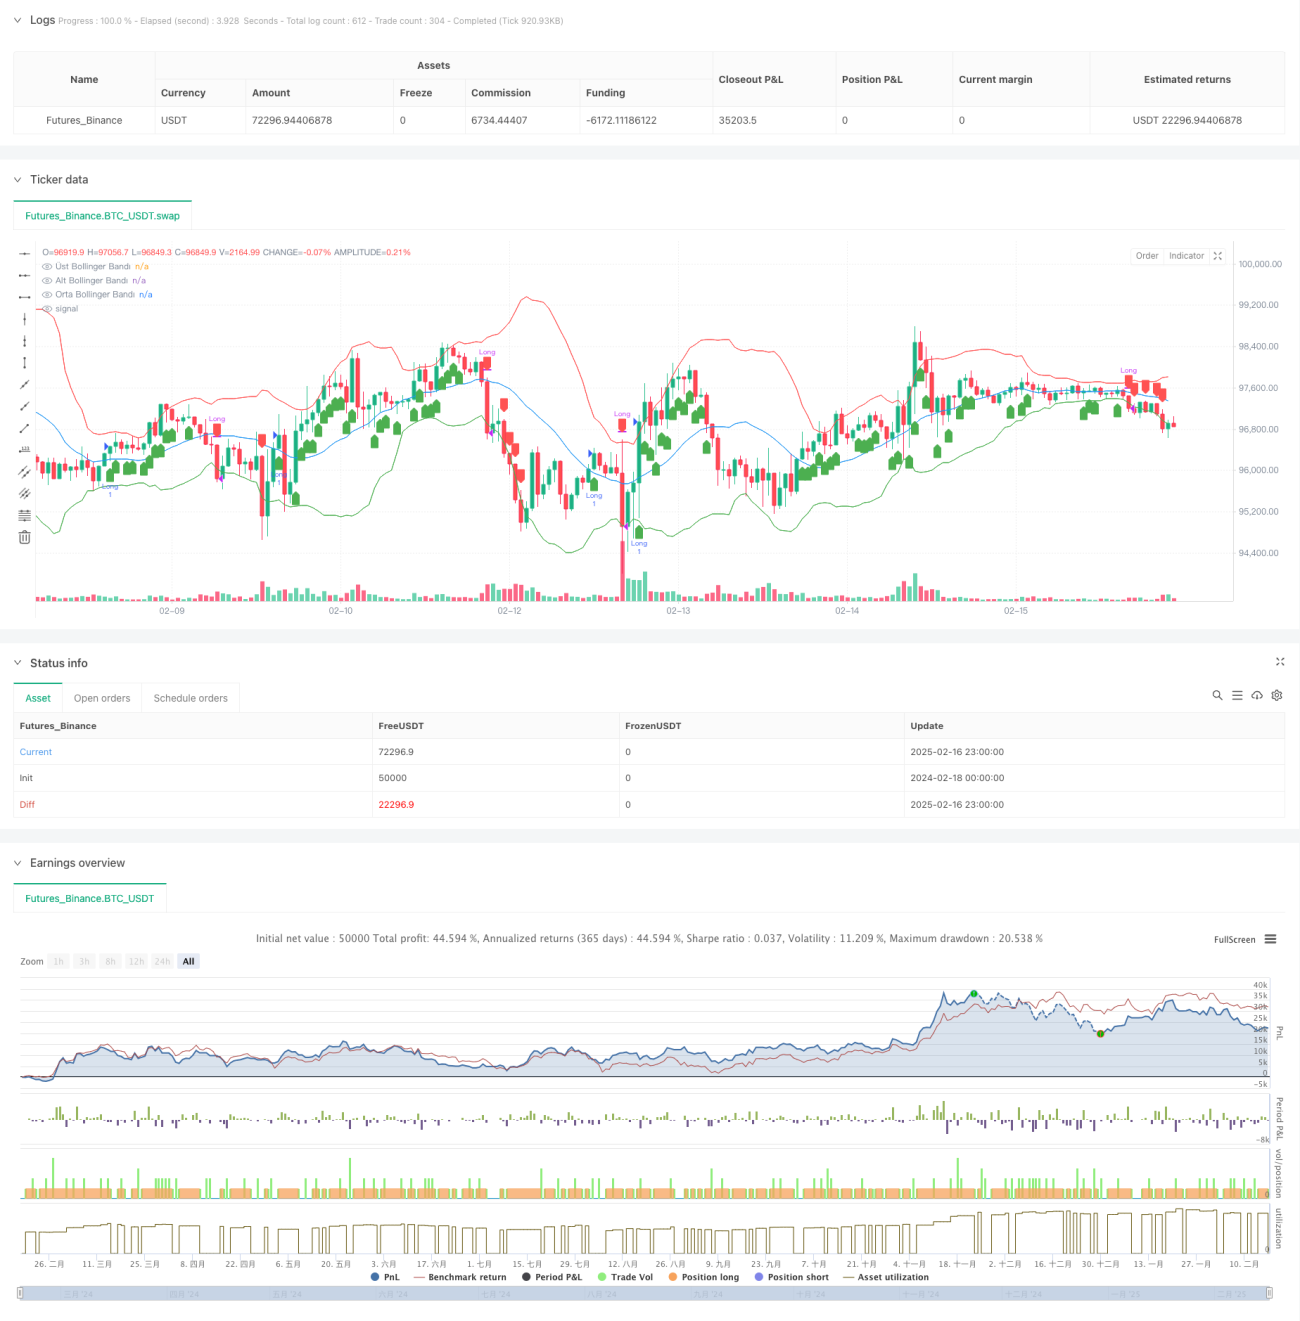
/*backtest
start: 2024-02-18 00:00:00
end: 2025-02-17 00:00:00
period: 1h
basePeriod: 1h
exchanges: [{"eid":"Futures_Binance","currency":"BTC_USDT"}]
*/

// This Pine Script™ code is subject to the terms of the Mozilla Public License 2.0 at https://mozilla.org/MPL/2.0/
// © ahmetkaratas4238

//@version=5- 1