
Overview
This strategy is a technical analysis trading system that combines the Gaussian Channel and Stochastic RSI indicators. The Gaussian Channel forms dynamic support and resistance levels using exponential moving average (EMA) and standard deviation multiplier, while the Stochastic RSI smooths RSI values to generate %K and %D lines for confirming potential reversals. The strategy is applicable to any timeframe and provides traders with a systematic trading approach.
Strategy Principles
The core logic of the strategy is based on the following key elements:
- Gaussian Channel Construction: Uses EMA as the basis line and creates upper and lower channels through standard deviation multiplier. The upper channel serves as dynamic resistance while the lower channel acts as dynamic support.
- Stochastic RSI Signals: Calculates traditional RSI and then applies stochastic treatment to generate smoother %K and %D lines.
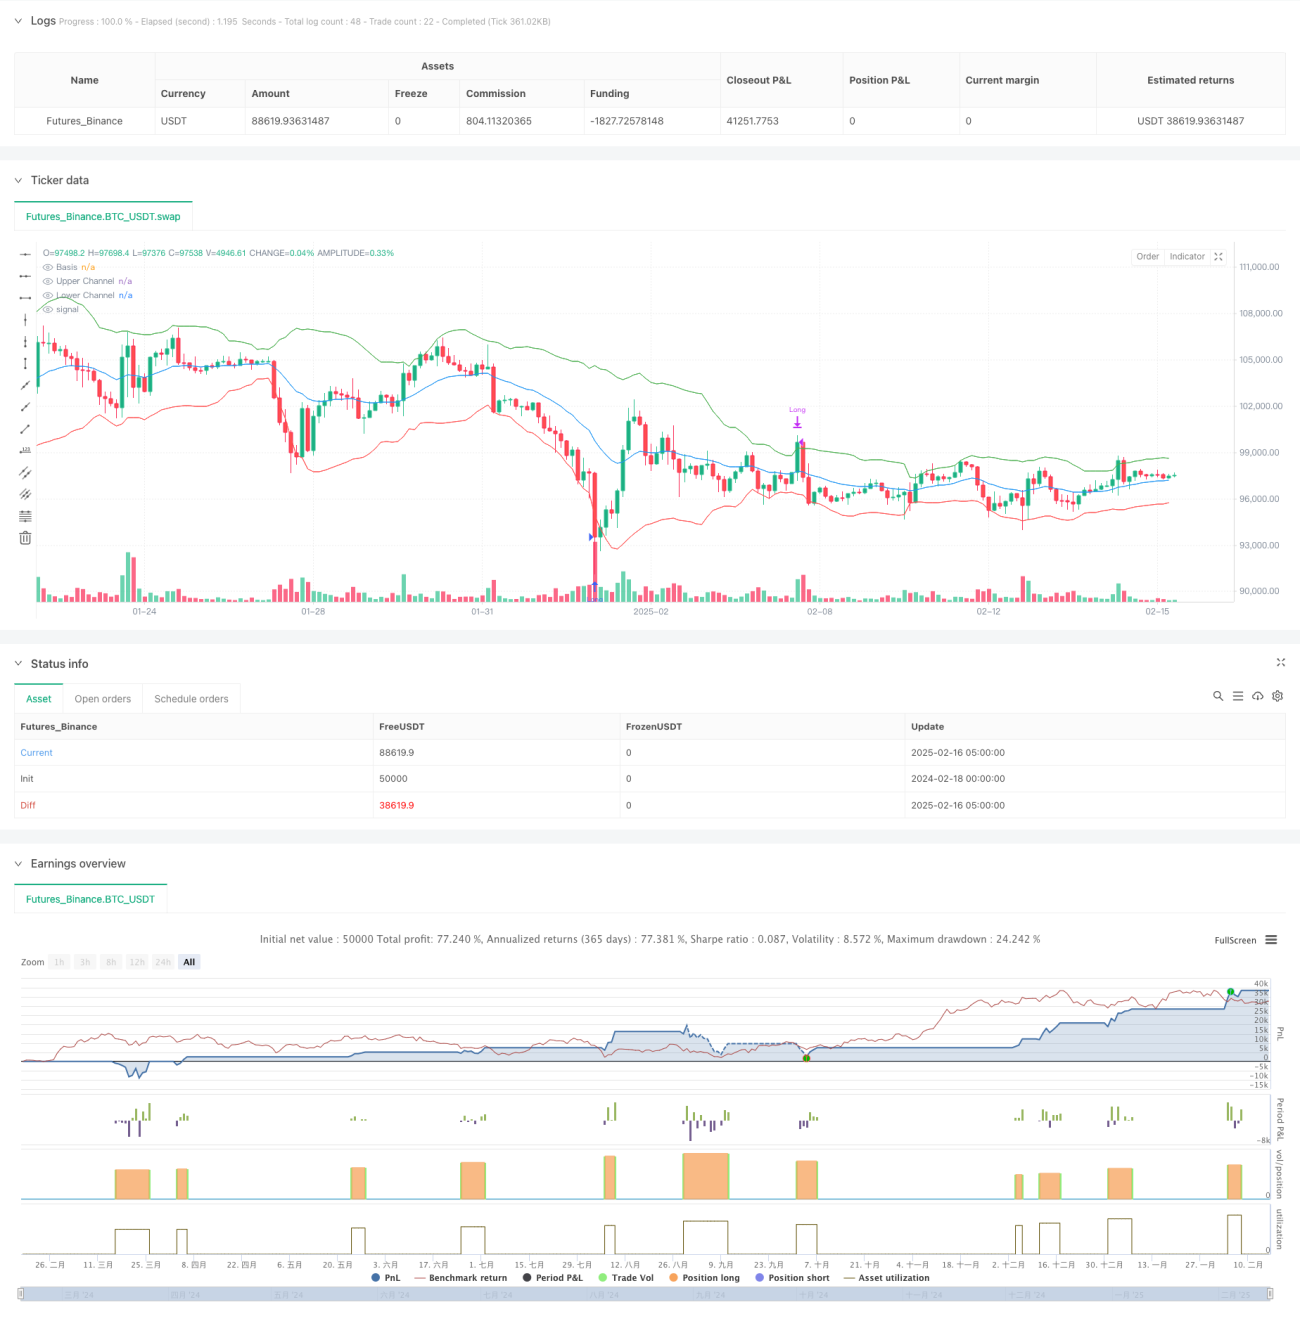
- Trade Signal Generation: Long signals are generated when price breaks below the lower channel and the Stochastic RSI %K line crosses above the %D line; positions are closed when price breaks above the upper channel.
- Time Filtering: Strategy includes a customizable date range filter allowing backtesting or trading within specific time periods.
Strategy Advantages
- Multiple Confirmation Mechanism: Combines trend following (Gaussian Channel) and momentum reversal (Stochastic RSI) approaches to improve signal reliability.
- Dynamic Adaptability: Gaussian Channel automatically adjusts bandwidth based on market volatility, providing good market adaptability.
- Integrated Risk Management: Incorporates risk control mechanism using upper channel breakout as stop-loss signal.
- Parameter Flexibility: All key parameters can be optimized and adjusted for different market conditions.
Strategy Risks
- False Breakout Risk: May generate numerous false signals in ranging markets, leading to frequent trading.
- Lag Risk: Signal generation may experience some delay due to multiple moving average calculations.
- Parameter Sensitivity: Strategy performance is sensitive to parameter selection, different market environments may require different parameter settings.
- Market Environment Dependency: Strategy may not perform ideally in markets without clear trends.
Strategy Optimization Directions
- Signal Filter Enhancement: Can add volume, volatility, and other auxiliary indicators to improve signal quality.
- Dynamic Parameter Optimization: Introduce adaptive parameter adjustment mechanism to dynamically adjust parameters based on market conditions.
- Stop-Loss Mechanism Improvement: Can add trailing stop-loss or volatility-based dynamic stop-loss.
- Market Environment Recognition: Add market condition identification module to adopt different strategy parameters or trading rules under different market conditions.
Summary
This strategy builds a trading system combining trend following and reversal capture capabilities through the integration of Gaussian Channel and Stochastic RSI. The strategy design considers multiple technical analysis dimensions, with solid theoretical foundation and practical feasibility. Through proper parameter optimization and risk management, the strategy has the potential to achieve stable performance across various market environments. However, users need to fully understand the strategy's advantages and limitations, making targeted adjustments based on actual trading conditions.
- 1