
Overview
This strategy is a breakout trading system that combines Bollinger Bands, Relative Strength Index (RSI), and Heikin Ashi candlesticks. Through the coordinated use of multiple technical indicators, it effectively filters market noise and captures high-probability breakout trading opportunities. The strategy adopts trend-following and momentum trading concepts, entering after breakout confirmation and using Heikin Ashi reversal and RSI overbought conditions as exit signals.
Strategy Principles
The core logic is based on the synergy of three technical indicators:
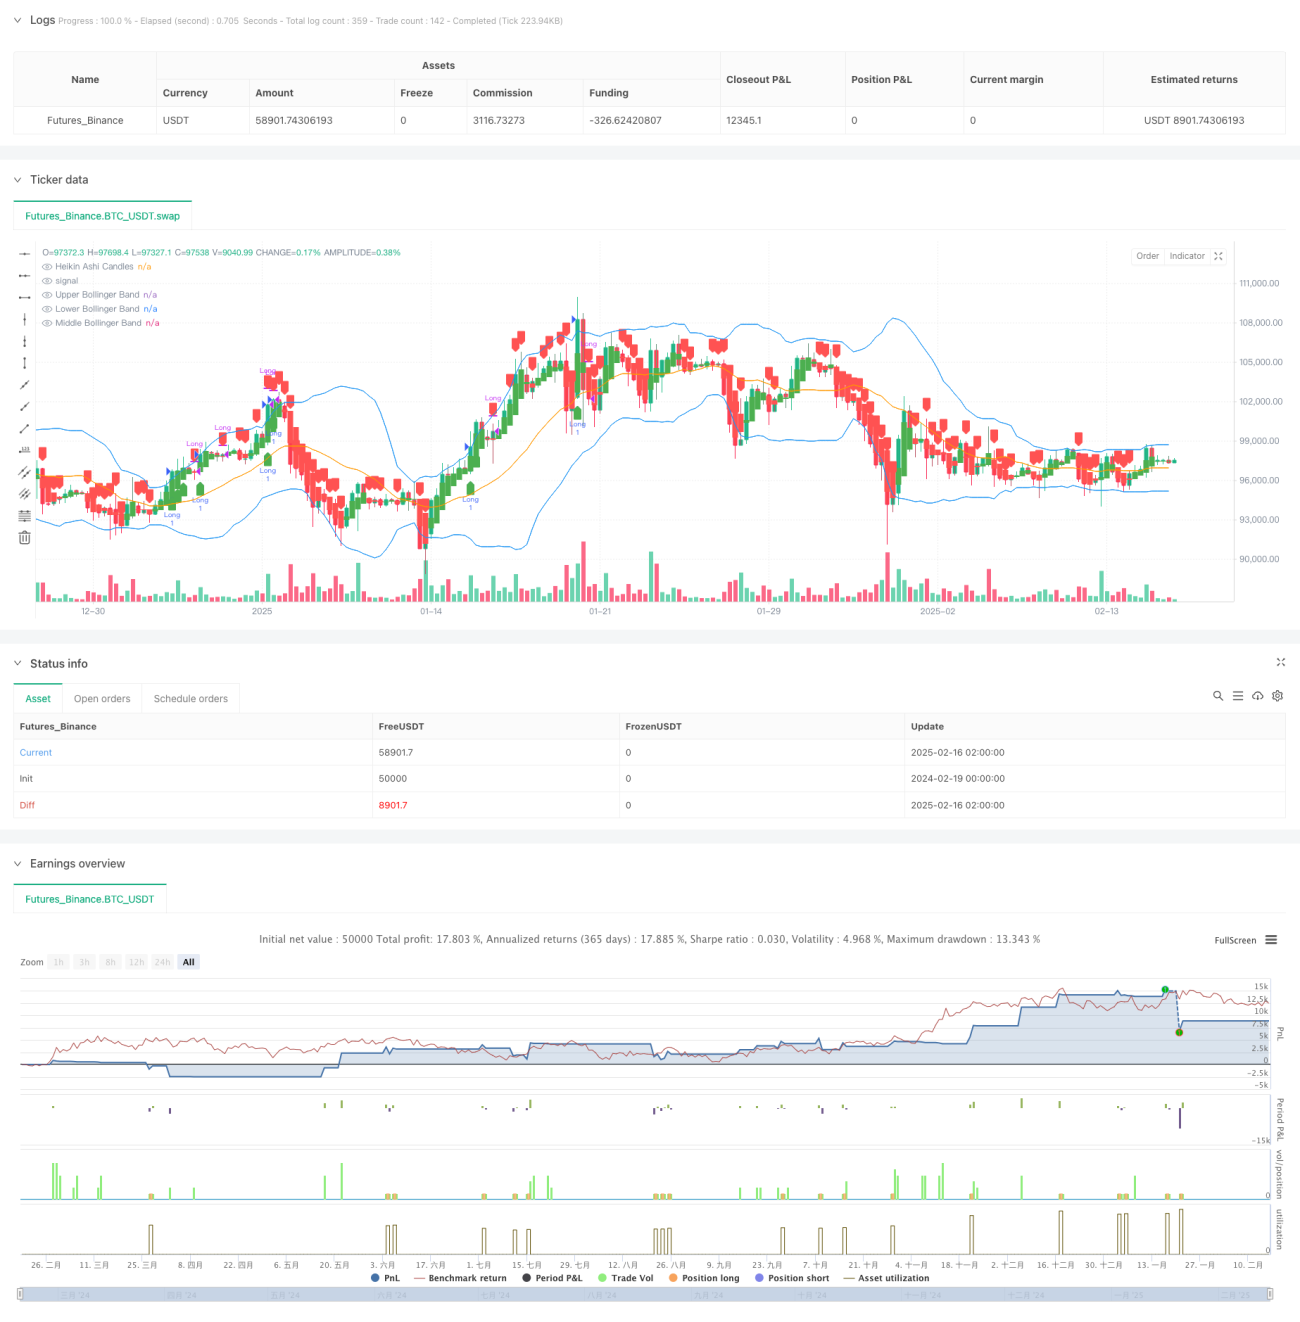
- Bollinger Bands identify price volatility range and potential breakout positions, using 20-day moving average as the middle band, with upper and lower bands 2 standard deviations away.
- RSI confirms price momentum, using 14-period settings, with RSI above 50 indicating upward momentum.
- Heikin Ashi candlesticks filter short-term price fluctuations through weighted averages of open, high, low, and close prices.
Entry conditions require:
- Heikin Ashi candles turn from red to green
- Close price breaks above upper Bollinger Band
- RSI above 50
Exit conditions meet either:
- Heikin Ashi candles turn from green to red
- RSI reaches overbought level of 70
Strategy Advantages
- Multiple technical indicators enhance trading signal reliability
- Heikin Ashi candlesticks effectively reduce false breakouts
- RSI inclusion ensures trading with trend direction
- Clear entry and exit mechanisms avoid subjective judgment
- Simple strategy logic, easy to understand and execute
- Parameters can be flexibly adjusted for different market characteristics
Strategy Risks
- May generate frequent false signals in ranging markets
- Strict entry conditions might miss some trading opportunities
- Reliance on technical indicators may fail during rapid market changes
- Fundamental factors not considered in market analysis
- Exit mechanism may lead to missed profit potential
Risk control suggestions:
- Set stop-loss positions to protect capital
- Adjust Bollinger Bands parameters based on market volatility
- Incorporate additional market analysis dimensions
- Strictly execute trading plan
Strategy Optimization Directions
- Introduce adaptive parameters:
- Dynamically adjust Bollinger Bands multiplier based on market volatility
- Optimize RSI parameters based on market conditions
- Add filtering conditions:
- Include volume confirmation
- Consider longer-term moving average trends
- Incorporate market volatility indicators
- Improve stop-loss mechanism:
- Design trailing stop-loss
- Add risk-reward ratio control
- Optimize position management plan
- Enhance signal system:
- Develop signal strength scoring
- Design signal confirmation mechanism
- Optimize exit timing determination
Summary
This strategy constructs a relatively complete trend-following trading system through the combined application of Bollinger Bands, RSI, and Heikin Ashi candlesticks. The strategy logic is clear with explicit execution standards, demonstrating good practicality. Through parameter optimization and additional auxiliary indicators, the strategy's stability and reliability can be further improved. Traders are advised to conduct thorough backtesting before live implementation and make appropriate adjustments based on market characteristics and personal risk preferences.
- 1