High Reward-to-Risk Price Structure Breakout Trading Strategy

RR SL TP ATH ATL
Created on: 2025-02-18 15:42:01 Modified on: 2025-02-18 15:42:01
Copy: 1 Number of hits: 393
avatar of ChaoZhang ChaoZhang
1
Follow
1617
Followers

 High Reward-to-Risk Price Structure Breakout Trading Strategy

Overview

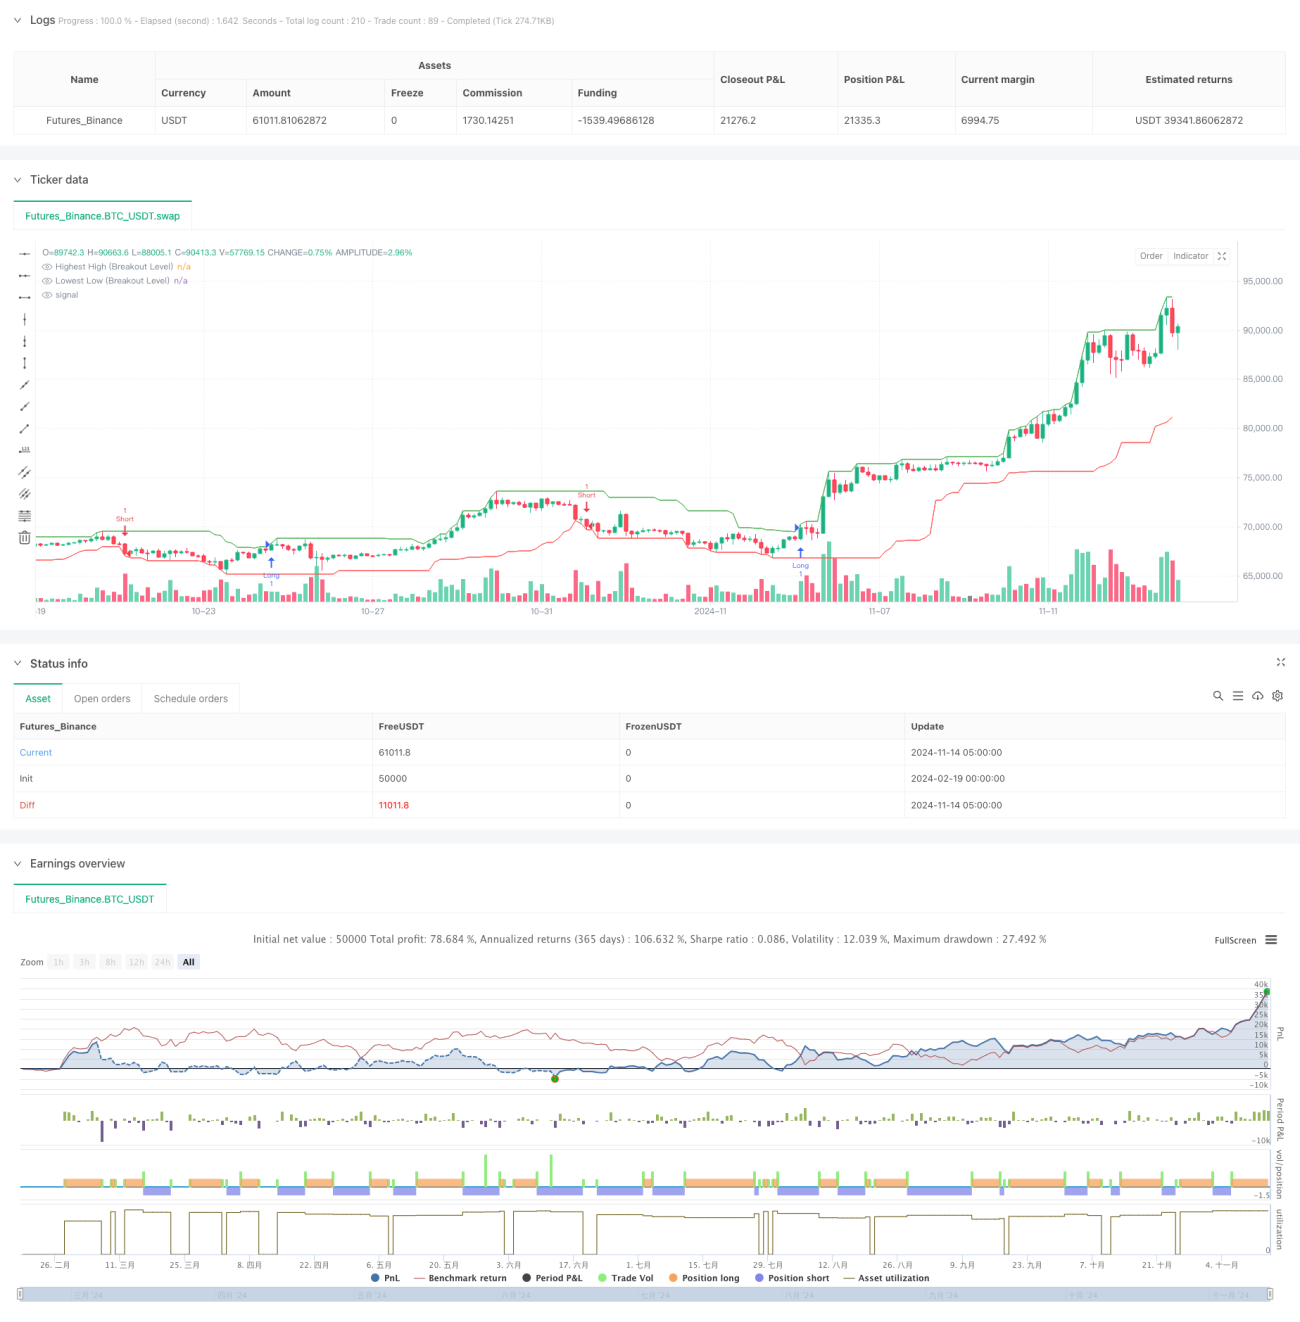
This is a pure price action breakout trading strategy with a 1:5 risk-reward ratio design. The strategy executes trades by identifying breakouts of key price levels and dynamically sets stop-loss and profit targets based on market structure. It operates without any technical indicators, relying solely on real-time price action for trading decisions.

Strategy Principles

The core logic includes several key components: 1. Identifies highest and lowest price levels through a lookback period to establish breakout reference points 2. Opens long positions when closing price breaks above previous highs, and short positions when breaking below previous lows 3. Sets dynamic stop-loss levels based on recent volatility, with longs stopped at swing lows and shorts at swing highs 4. Calculates profit targets based on a 1:5 risk-reward ratio 5. Implements daily trade limits to prevent overtrading The entire trading process is based purely on price action without any technical indicators.

Strategy Advantages

  1. Pure price action trading, avoiding indicator lag interference
  2. High risk-reward ratio design, with potential profit 5 times the risk per trade
  3. Dynamic stop-loss setting that adapts to market structure
  4. Clear trading signals and visual markers for easy execution
  5. Highly adjustable parameters to adapt to different market conditions
  6. Strict risk control, including daily trade limits

Strategy Risks

  1. May generate frequent false breakout signals in ranging markets
  2. High risk-reward ratio might result in relatively lower win rate
  3. Post-breakout retracements may trigger stop-losses
  4. Market volatility changes can affect strategy performance
  5. Requires significant price movement to reach profit targets

Mitigation measures: - Use the strategy in trending markets - Avoid trading during major news releases - Set appropriate position sizes - Regularly review and optimize parameters

Strategy Optimization Directions

  1. Add trend filters to trade only in the main trend direction
  2. Implement volume confirmation to improve breakout reliability
  3. Dynamically adjust risk-reward ratio based on volatility
  4. Incorporate multi-timeframe analysis for better accuracy
  5. Develop smarter stop-loss mechanisms, such as trailing stops
  6. Add market condition recognition for adaptive parameter adjustment

Summary

This is a well-designed price action trading strategy with clear logic. Through its high risk-reward ratio design, it pursues substantial returns while effectively controlling risk. The strategy’s strengths lie in its pure price-driven approach, flexible parameters, and comprehensive risk control. While there are risks of false breakouts, the suggested optimization directions can further enhance the strategy’s stability and reliability. The strategy is best suited for clearly trending markets and requires strict trading discipline from the trader.

Strategy source code
/*backtest
start: 2024-02-19 00:00:00
end: 2024-11-14 08:00:00
period: 3h
basePeriod: 3h
exchanges: [{"eid":"Futures_Binance","currency":"BTC_USDT"}]
*/

//@version=6
strategy("Filtered Price Action Breakout", overlay=true)

// === INPUTS ===
lookback = input.int(20, title="Breakout Lookback Period", minval=5)
stopLookback = input.int(10, title="Stop Loss Lookback Period", minval=3)
rrMultiplier = input.float(5.0, title="Risk-to-Reward Multiplier", step=0.1)
maxTradesPerDay = input.int(5, title="Max Trades Per Day", minval=1)

// Ensure there are enough bars for calculations
inRange = bar_index >= lookback

// === CALCULATIONS ===
// Highest high and lowest low over the 'lookback' period
highestHigh = ta.highest(high, lookback)
lowestLow = ta.lowest(low, lookback)

// Define breakout conditions (using previous bar's level)
bullBreakout = ta.crossover(close, highestHigh[1])
bearBreakout = ta.crossunder(close, lowestLow[1])

// Store breakout signals in variables to prevent inconsistencies
bullBreakoutSignal = bullBreakout
bearBreakoutSignal = bearBreakout

// Determine stop levels based on recent swing lows/highs
longStop = ta.lowest(low, stopLookback)
shortStop = ta.highest(high, stopLookback)

// Track number of trades per day (fixing boolean condition issue)
newDay = ta.change(time("D")) != 0
todayTrades = ta.barssince(newDay)
tradeCount = 0
if newDay
    tradeCount := 0
else
    tradeCount := tradeCount + 1

// === STRATEGY LOGIC: ENTRY & EXIT ===
if bullBreakoutSignal and tradeCount < maxTradesPerDay
    entryPrice = close
    stopLevel = longStop
    risk = entryPrice - stopLevel
    if risk > 0
        target = entryPrice + rrMultiplier * risk
        strategy.entry("Long", strategy.long)
        strategy.exit("Long Exit", from_entry="Long", stop=stopLevel, limit=target)
        tradeCount := tradeCount + 1
        
        // // Draw Markups
        // label.new(bar_index, entryPrice, text="Long Entry", color=color.green, textcolor=color.white, size=size.small, style=label.style_label_down)
        // line.new(x1=bar_index, y1=entryPrice, x2=bar_index + 5, y2=entryPrice, color=color.green, width=2)
        // line.new(x1=bar_index, y1=stopLevel, x2=bar_index + 5, y2=stopLevel, color=color.red, width=2, style=line.style_dotted)
        // line.new(x1=bar_index, y1=target, x2=bar_index + 5, y2=target, color=color.blue, width=2, style=line.style_dashed)
        // label.new(bar_index, stopLevel, text="Stop Loss", color=color.red, textcolor=color.white, size=size.small, style=label.style_label_down)
        // label.new(bar_index, target, text="Target", color=color.blue, textcolor=color.white, size=size.small, style=label.style_label_up)

if bearBreakoutSignal and tradeCount < maxTradesPerDay
    entryPrice = close
    stopLevel = shortStop
    risk = stopLevel - entryPrice
    if risk > 0
        target = entryPrice - rrMultiplier * risk
        strategy.entry("Short", strategy.short)
        strategy.exit("Short Exit", from_entry="Short", stop=stopLevel, limit=target)
        tradeCount := tradeCount + 1
        
        // // Draw Markups
        // label.new(bar_index, entryPrice, text="Short Entry", color=color.red, textcolor=color.white, size=size.small, style=label.style_label_up)
        // line.new(x1=bar_index, y1=entryPrice, x2=bar_index + 5, y2=entryPrice, color=color.red, width=2)
        // line.new(x1=bar_index, y1=stopLevel, x2=bar_index + 5, y2=stopLevel, color=color.green, width=2, style=line.style_dotted)
        // line.new(x1=bar_index, y1=target, x2=bar_index + 5, y2=target, color=color.blue, width=2, style=line.style_dashed)
        // label.new(bar_index, stopLevel, text="Stop Loss", color=color.green, textcolor=color.white, size=size.small, style=label.style_label_up)
        // label.new(bar_index, target, text="Target", color=color.blue, textcolor=color.white, size=size.small, style=label.style_label_down)

// === PLOTTING ===
plot(highestHigh, color=color.green, title="Highest High (Breakout Level)")
plot(lowestLow, color=color.red, title="Lowest Low (Breakout Level)")