
Overview
This strategy is a hybrid trading system that combines multiple technical analysis indicators. It primarily uses the Exponential Moving Average (EMA) system to determine market trends, while incorporating Support and Resistance (SR) levels for entry signals and Average True Range (ATR) for risk control. The strategy employs dynamic stop-loss settings that can adaptively adjust based on market volatility.
Strategy Principles
The strategy operates based on the following core components:
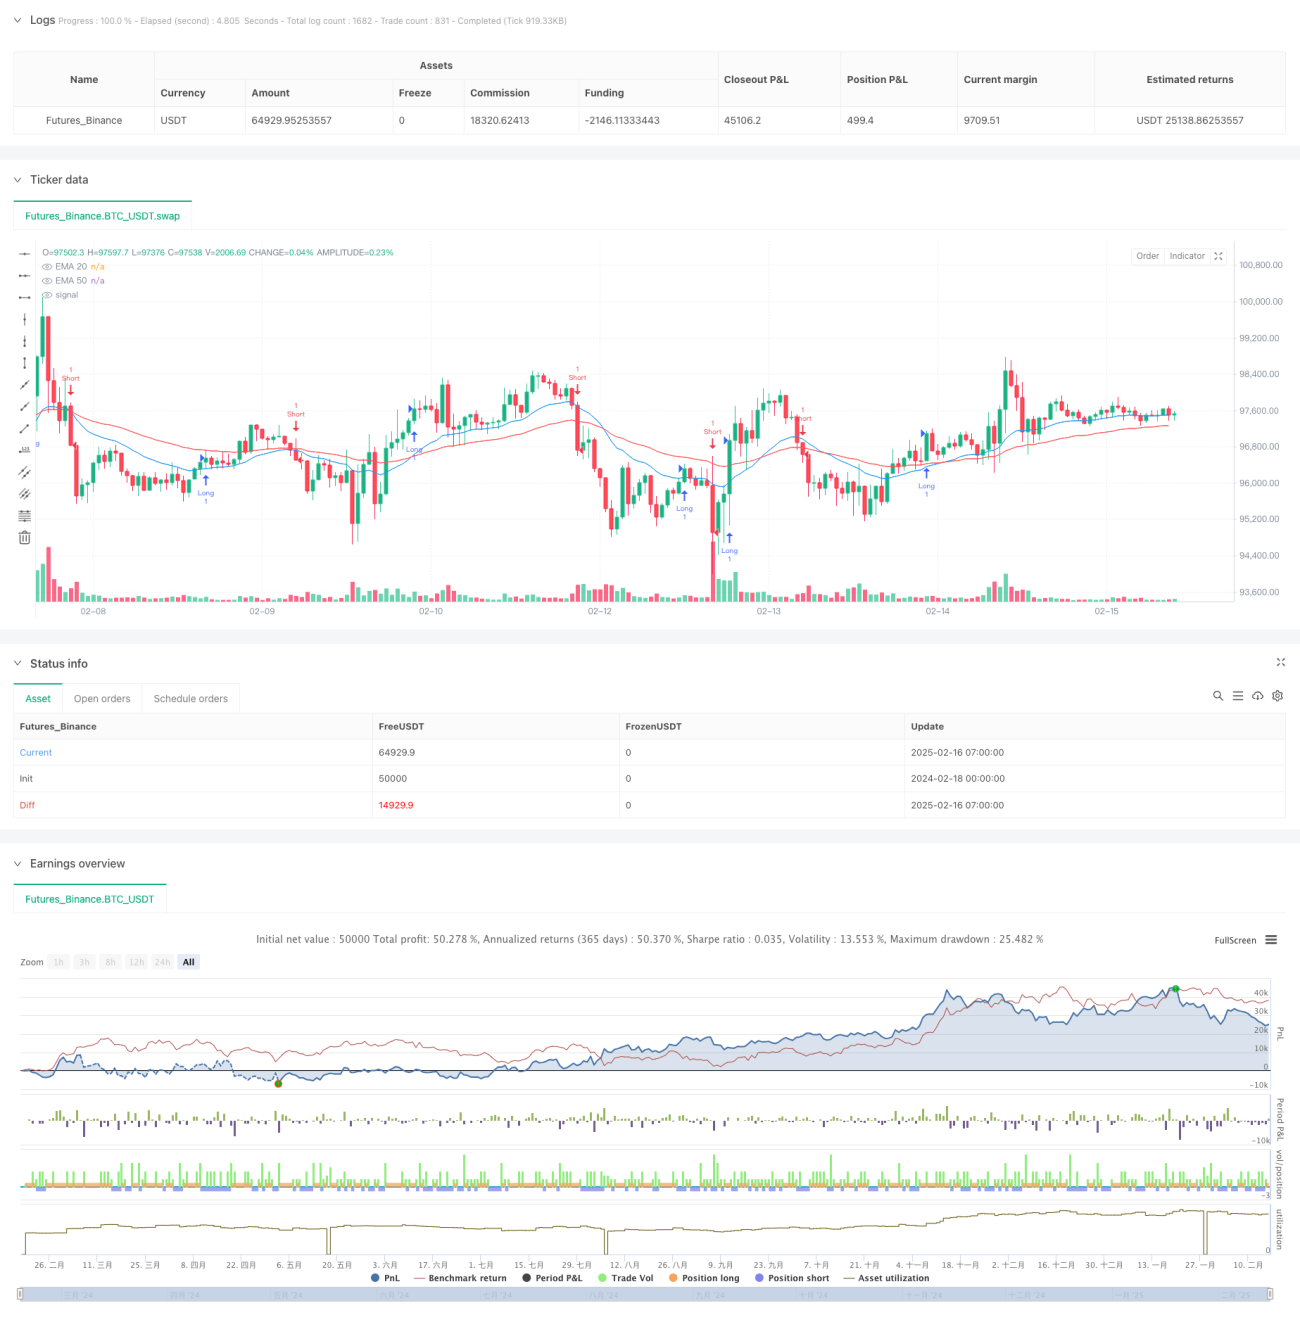
- Trend Determination System - Uses the spatial relationship and difference between 20-period and 50-period EMAs to judge trend strength
- Breakthrough Signal System - Constructs support and resistance levels using 9-period high and low prices
- Risk Control System - Uses 14-period ATR to dynamically adjust stop-loss distances
- Entry logic includes two conditions:
- Price breaks through support/resistance levels
- In trend and price is in the correct EMA direction
- Exit logic based on ATR dynamic stop-loss, with stop distance set at 10 times ATR
Strategy Advantages
- Multi-dimensional Confirmation - Combines trend following and breakout trading for improved signal reliability
- Strong Adaptability - Dynamically adjusts stops through ATR, adapting to different market environments
- Comprehensive Risk Control - Has clear stop-loss mechanisms that adjust with market volatility
- High Systematization - Clear trading rules, unaffected by subjective judgment
- Good Scalability - Stable core framework, easy to add new trading rules
Strategy Risks
- Oscillation Market Risk - May generate frequent false signals in sideways markets
- Slippage Risk - Breakout trades may face significant slippage during high volatility
- Stop-Loss Range Risk - Large ATR multiplier settings may lead to significant drawdowns
- Signal Delay Risk - Moving average system has inherent lag
- Parameter Sensitivity - Multiple parameters require thorough testing and optimization
Strategy Optimization Directions
-
Signal Filtering Optimization
- Add volume confirmation mechanism
- Introduce volatility filters
- Integrate more technical indicators for verification
-
Position Management Optimization
- Implement dynamic position management
- Adjust position size based on volatility
- Add staged position building mechanism
-
Stop-Loss Optimization
- Introduce trailing stops
- Optimize ATR multiplier settings
- Add profit protection mechanism
Summary
This strategy constructs a complete trading system by combining multiple mature technical analysis methods. Its core advantages lie in system adaptability and risk control capabilities. Through continuous optimization and improvement, the strategy shows promise in maintaining stable performance across different market environments. Traders are advised to conduct thorough historical data testing and parameter optimization before live trading.
- 1