Multi-Level Support Resistance Weekly Mean Reversion Trading Strategy

Pivot SR MR SMA RSI ATR MA VOL
Created on: 2025-02-18 18:04:15 Modified on: 2025-02-18 18:04:15
Copy: 2 Number of hits: 441
avatar of ChaoZhang ChaoZhang
1
Follow
1617
Followers

 Multi-Level Support Resistance Weekly Mean Reversion Trading Strategy

Overview

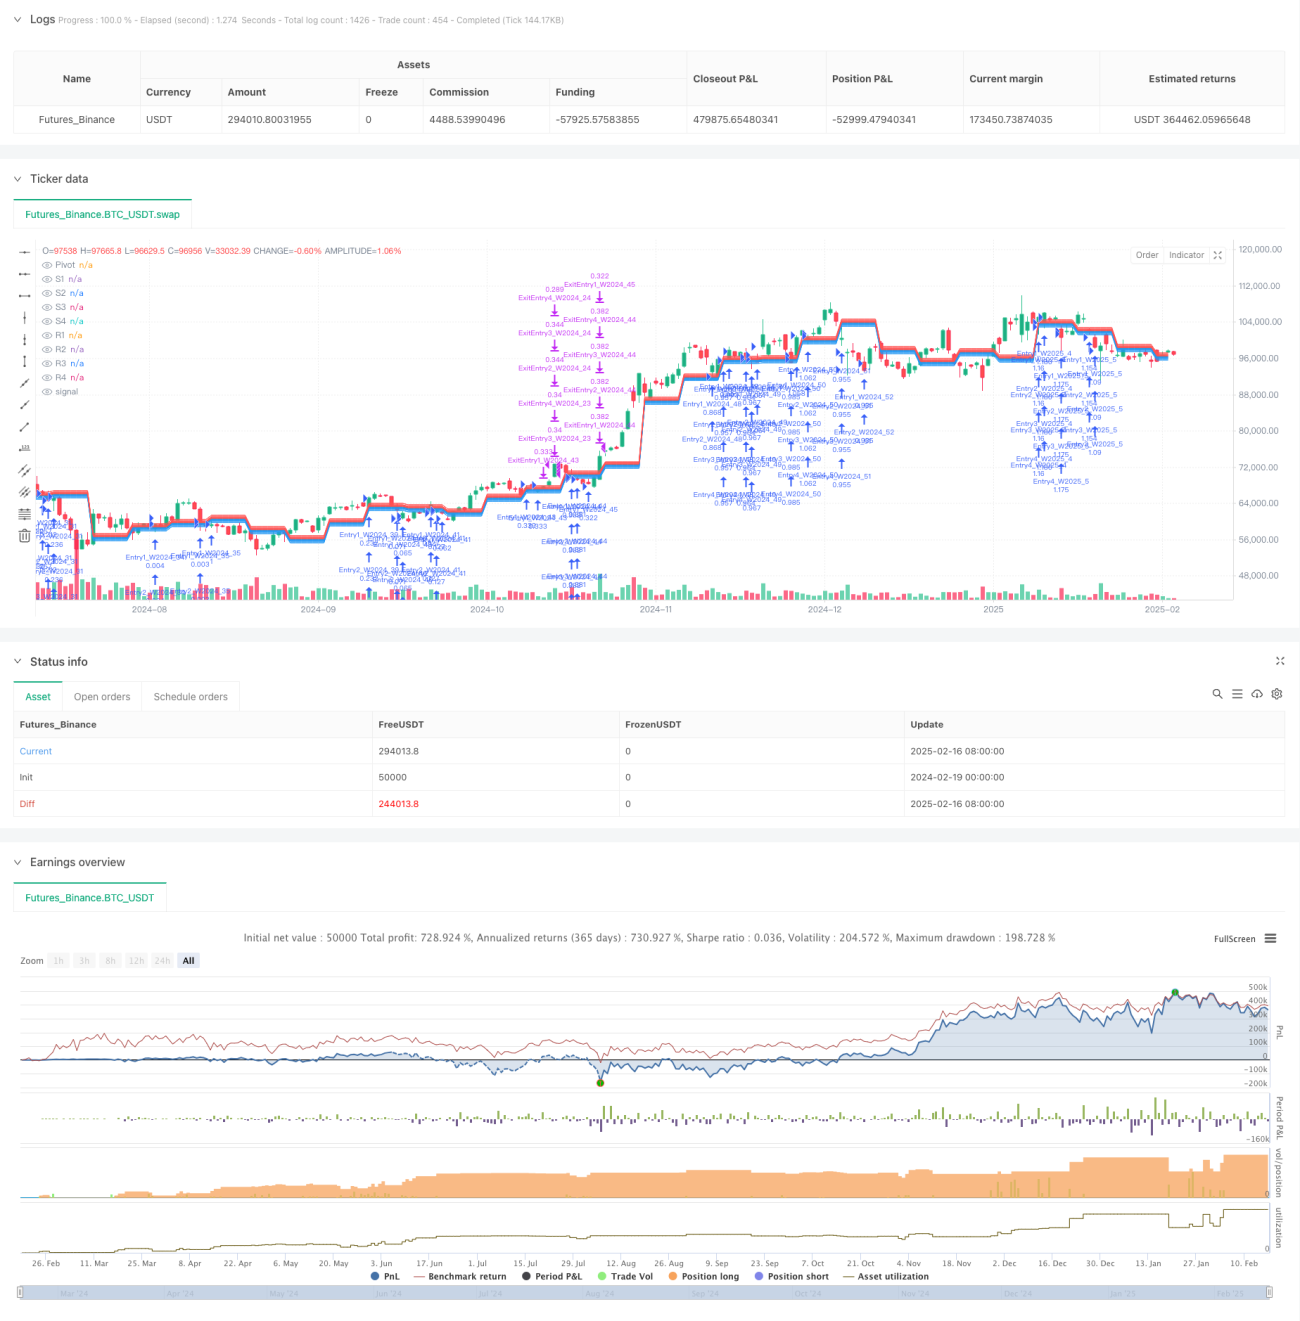
This strategy is a mean reversion trading system based on weekly pivot points. It determines entry and exit points by calculating weekly support (S1-S4) and resistance (R1-R4) levels. The strategy employs a stepped position building approach, executing multiple buys at different support levels and taking profits at corresponding resistance levels. This method effectively utilizes market volatility characteristics and performs well in range-bound markets.

Strategy Principles

The core mechanism calculates the pivot point for the current week using the previous week’s high, low, and closing prices, then determines multiple support and resistance levels based on preset point distances. Buys are executed when price touches support levels, with profit targets set at corresponding resistance levels. The specific formula is: Pivot Point = (Previous Week’s High + Previous Week’s Low + Previous Week’s Close) / 3 The strategy allows up to 4 concurrent positions, each corresponding to different support and resistance levels. All positions are recalculated at the beginning of each week. This design ensures trading continuity while adapting to market changes.

Strategy Advantages

  1. Clear trading logic that is easy to understand and execute
  2. Stepped position building approach reduces single trade risk
  3. Weekly level support/resistance reduces daily noise impact
  4. Parameters can be flexibly adjusted for different markets
  5. Risk control through percentage-based position sizing
  6. No time-based forced exits, allowing sufficient profit potential

Strategy Risks

  1. Absence of stop-loss may lead to significant drawdowns in trending markets
  2. Multiple positions may tie up substantial capital
  3. False signals may occur in highly volatile markets
  4. Improper support level settings may result in suboptimal entry positions To mitigate risks, consider adding trend filters to only enter during uptrends and implementing dynamic ATR-based stop-losses.

Optimization Directions

  1. Add volume confirmation mechanism to improve entry signal reliability
  2. Incorporate technical indicators like RSI for overbought/oversold filtering
  3. Develop multiple timeframe confirmation to reduce false signals
  4. Optimize position management system with dynamic position sizing based on volatility
  5. Include correlation analysis to avoid simultaneous positions in highly correlated markets

Summary

This is a mean reversion strategy based on classical technical analysis theory, capturing trading opportunities through weekly support and resistance level breakouts and reversals. The strategy design is concise yet flexible, suitable for markets with significant volatility. Through proper parameter optimization and risk management, this strategy can maintain stable performance across different market environments. Traders are advised to thoroughly test parameter settings and make appropriate adjustments based on specific market characteristics before live trading.

Strategy source code
/*backtest
start: 2024-02-19 00:00:00
end: 2025-02-17 00:00:00
period: 1d
basePeriod: 1d
exchanges: [{"eid":"Futures_Binance","currency":"BTC_USDT"}]
*/

// This Pine Script™ code is subject to the terms of the Mozilla Public License 2.0 at https://mozilla.org/MPL/2.0/
// © ViZiV

//@version=5
strategy("Weekly Pivot Strategy, Created by ViZiV", overlay=true, pyramiding=50, initial_capital=100000, default_qty_type=strategy.percent_of_equity, default_qty_value=25, dynamic_requests=true)

// This is my first COMPLETED strategy, go easy on me :) - Feel free to imrprove upon this script by adding more features if you feel up to the task. Im 100% confiedent there are better coders than me :) I'm still learning.

// This is a LONG ONLY SWING STRATEGY (Patience REQUIRED) that being said, you can go short at you're own discretion. I prefer to use on NQ / US100 / USTech 100 but not limited to it. Im sure it can work in most markets. "You'll need to change settings to suit you're market".

// IMPORTANT NOTE: "default_qty_type=strategy.percent_of_equity" Can be changed to "Contacts" within the properties tab which allow you to see backtest of other markets. Reccomend 1 contract but it comes to preference.

// Inputs for support/resistance distances (Defined by Points). // IMPORTANT NOTE: Completely user Defined. Figure out best settings for what you're trading. Each market is different with different characteristics. Up to you to figure out YOU'RE market volatility for better results. 
s1_offset = input.float(155, "S1 Distance", step=1)
s2_offset = input.float(310, "S2 Distance", step=1)
s3_offset = input.float(465, "S3 Distance", step=1)
s4_offset = input.float(775, "S4 Distance", step=1)
r1_offset = input.float(155, "R1 Distance", step=1)
r2_offset = input.float(310, "R2 Distance", step=1)
r3_offset = input.float(465, "R3 Distance", step=1)
r4_offset = input.float(775, "R4 Distance", step=1)

// Weekly pivot calculation
var float pivot = na
var float s1 = na
var float s2 = na
var float s3 = na
var float s4 = na
var float r1 = na
var float r2 = na
var float r3 = na
var float r4 = na

// Get weekly data (Pivot Calculation)
prevWeekHigh = request.security(syminfo.tickerid, "W", high[1], lookahead=barmerge.lookahead_on)
prevWeekLow = request.security(syminfo.tickerid, "W", low[1], lookahead=barmerge.lookahead_on)
prevWeekClose = request.security(syminfo.tickerid, "W", close[1], lookahead=barmerge.lookahead_on)

// Track active trades
var array<string> entry_ids = array.new<string>(0)
var array<float> profit_targets = array.new<float>(0)

// Update weekly levels
isNewWeek = ta.change(time("W")) != 0
if isNewWeek or na(pivot)
    pivot := (prevWeekHigh + prevWeekLow + prevWeekClose) / 3
    s1 := pivot - s1_offset
    s2 := pivot - s2_offset
    s3 := pivot - s3_offset
    s4 := pivot - s4_offset
    r1 := pivot + r1_offset
    r2 := pivot + r2_offset
    r3 := pivot + r3_offset
    r4 := pivot + r4_offset

// Plot current week's levels
plot(pivot, "Pivot", color=color.gray, linewidth=2)
plot(s1, "S1", color=color.blue, linewidth=1)
plot(s2, "S2", color=color.blue, linewidth=1)
plot(s3, "S3", color=color.blue, linewidth=1)
plot(s4, "S4", color=color.blue, linewidth=1)
plot(r1, "R1", color=color.red, linewidth=1)
plot(r2, "R2", color=color.red, linewidth=1)
plot(r3, "R3", color=color.red, linewidth=1)
plot(r4, "R4", color=color.red, linewidth=1)

// Function to create unique trade entries
checkEntry(level, target, entryNumber) =>
    currentWeek = str.tostring(year(time)) + "_" + str.tostring(weekofyear(time))
    entryId = "Entry" + str.tostring(entryNumber) + "_W" + currentWeek
    
    if low <= level and not array.includes(entry_ids, entryId)
        array.push(entry_ids, entryId)
        array.push(profit_targets, target)
        strategy.entry(entryId, strategy.long)
        strategy.exit("Exit" + entryId, entryId, limit=target)

// Check all entry levels
checkEntry(s1, r1, 1)
checkEntry(s2, r2, 2)
checkEntry(s3, r3, 3)
checkEntry(s4, r4, 4)

// Clean up completed trades using while loop
i = array.size(entry_ids) - 1
while i >= 0
    entryId = array.get(entry_ids, i)
    target = array.get(profit_targets, i)
    
    if high >= target
        array.remove(entry_ids, i)
        array.remove(profit_targets, i)
    i := i - 1