Dynamic Volume-Weighted Moving Average Trend Following with HLCC4 Breakout Trading Strategy

Overview
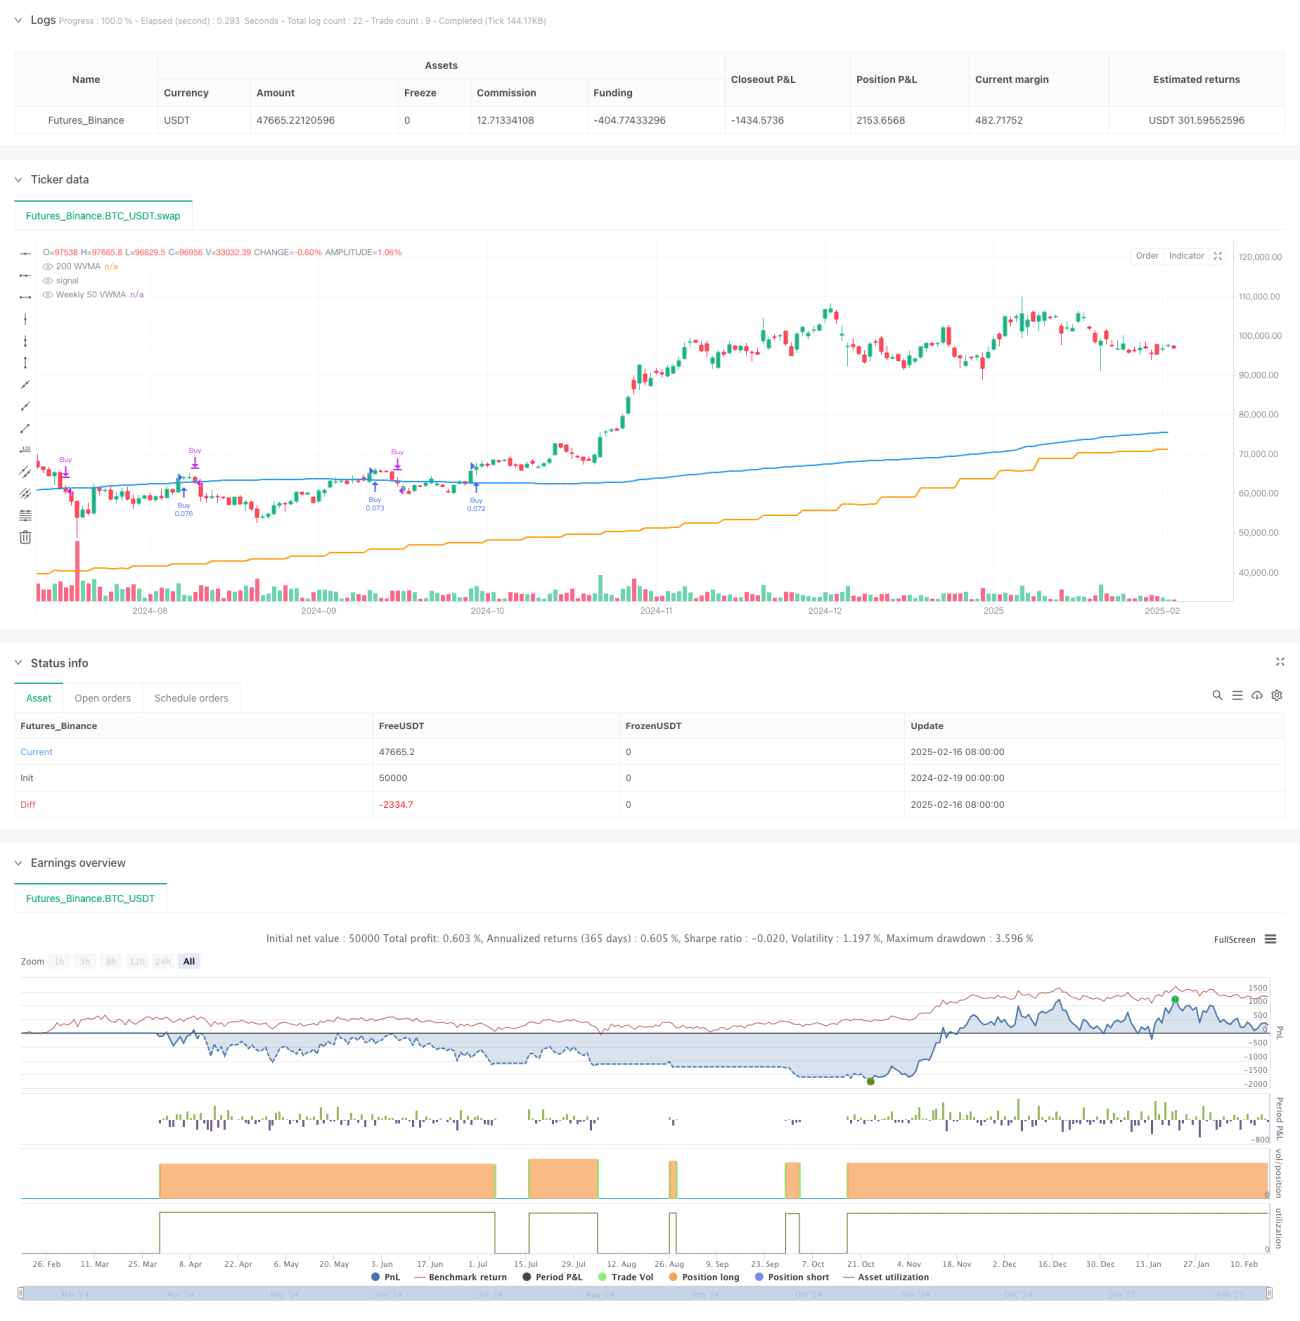
This strategy is a multi-timeframe trend following system that combines a 50-period Weekly Volume-Weighted Moving Average (VWMA) as a major trend filter, using the 200-period VWMA and HLCC4 price breakout on the current timeframe for specific trading signals. It is a long-only strategy that enhances trading reliability through strict trend confirmation and multi-timeframe validation.
Strategy Principles
The core logic includes several key components:
- Uses the 50-period Weekly VWMA as a major trend criterion, allowing positions only when price is above this moving average.
- Entry conditions require two consecutive closing prices above the 200-period VWMA, with the second candle's close higher than the first candle's HLCC4 average.
- Exit signals are based on the daily timeframe, closing positions when the daily close falls below the daily 200-period VWMA.
- The strategy employs fixed position sizing, using 10% of account equity per trade.
- Backtesting is restricted to the last 5 years to ensure strategy effectiveness in recent market conditions.
Strategy Advantages
- Multi-timeframe validation: Combines weekly and daily timeframes to capture major trends while responding to market changes timely.
- Robust risk control: Uses VWMA instead of simple moving averages for better reflection of true market trends.
- Rigorous trend confirmation: Requires multiple conditions to be met for entry, reducing false breakout risks.
- Rational position management: Fixed proportion position sizing controls risk while maintaining profit potential.
- High automation level: Clear strategy logic enables full automation implementation.
Strategy Risks
- Trend reversal risk: Significant drawdowns may occur during violent market fluctuations.
- Slippage impact: Actual trading prices may deviate from theoretical prices during low liquidity periods.
- Signal lag: Using longer-period moving averages may result in delayed reactions at trend turning points.
- False breakout risk: Despite multiple confirmations, losses from false breakouts are still possible.
- Unidirectional trading limitation: Being long-only, the strategy misses potential short opportunities in downtrends.
Strategy Optimization Directions
- Dynamic parameter optimization: Automatically adjust VWMA periods based on market volatility.
- Position management enhancement: Introduce volatility-based dynamic position sizing system.
- Exit mechanism improvement: Add trailing stops or technical indicator-based dynamic stop losses.
- Market sentiment integration: Incorporate RSI or MACD indicators to improve signal reliability.
- Volume analysis enhancement: Deepen volume analysis and optimize VWMA calculation methods.
Summary
This is a rigorously designed trend following strategy that achieves effective risk control through multi-timeframe coordination and strict trading conditions. Its core advantages lie in its comprehensive trend confirmation mechanism and clear trading logic, suitable for capturing medium to long-term trending opportunities in strong markets. Through the suggested optimization directions, the strategy has room for further improvement.
/*backtest
start: 2024-02-19 00:00:00
end: 2025-02-17 00:00:00
period: 1d
basePeriod: 1d
exchanges: [{"eid":"Futures_Binance","currency":"BTC_USDT"}]
*/

//@version=6
strategy("Long-Only 200 WVMA + HLCC4 Strategy (Weekly 50 VWMA Filter, Daily Exit, Last 5 Years)", overlay=true, default_qty_type=strategy.percent_of_equity, default_qty_value=10)

// Parameters- 1