
Overview
This strategy is a trend-following trading system based on Bollinger Bands breakouts and candlestick patterns. It identifies trading signals through three consecutive candles breaking the Bollinger Bands, combined with the position of closing prices within the candlestick bodies. The system employs a fixed 1:1 risk-reward ratio for managing stop-loss and take-profit levels.
Strategy Principles
The core logic is based on the following key elements:
- Uses 20-period Bollinger Bands as the primary indicator with a standard deviation multiplier of 2.0
- Long entry conditions: three consecutive candles closing above the upper band, all being bullish with closes in the upper half of their ranges
- Short entry conditions: three consecutive candles closing below the lower band, all being bearish with closes in the lower half of their ranges
- Stop-loss is set at the extreme point of the earliest signal candle
- Take-profit is set based on a 1:1 risk-reward ratio
Strategy Advantages
- Employs multiple confirmation mechanisms through consecutive breakout candles, effectively reducing false breakout risks
- Enhances trend confirmation reliability by considering closing price positions within candle bodies
- Uses fixed risk-reward ratio for position management, facilitating risk control
- Clear and easy-to-understand strategy logic
- Intuitive signal visualization through markers for backtest analysis
Strategy Risks
- May generate frequent false signals in ranging markets
- Fixed risk-reward ratio might not fully capture strong trends
- Strict three-candle requirement may miss potential opportunities
- Stop-loss placement at signal candle extremes may be too wide in volatile conditions
Risk management suggestions:
- Adjust Bollinger Bands parameters based on market volatility cycles
- Dynamically adjust risk-reward ratio according to market characteristics
- Add trend confirmation indicators
- Optimize stop-loss placement method
Strategy Optimization Directions
- Parameter Optimization:
- Dynamically adjust Bollinger Bands period and standard deviation multiplier based on market characteristics
- Consider changing three-candle requirement to dynamic judgment
- Signal Optimization:
- Add trend confirmation indicators like ADX or trendlines
- Introduce volume confirmation mechanism
- Consider adding oscillators as auxiliary indicators
- Position Management Optimization:
- Implement dynamic risk-reward ratio settings
- Add money management module
- Consider scaled entry and exit mechanisms
- Stop-Loss Optimization:
- Introduce trailing stop mechanism
- Set stop-loss distance based on ATR
- Consider time-based stops
Summary
This is a well-structured trend-following strategy with clear logic. Through multiple confirmation mechanisms using Bollinger Bands breakouts and candlestick patterns, it effectively reduces false signal risks. The fixed risk-reward ratio simplifies trade management but limits strategy flexibility. There is significant room for improvement through parameter optimization, additional confirmation indicators, and improved position management. Overall, it provides a practical basic strategy framework that can be further refined based on specific requirements.
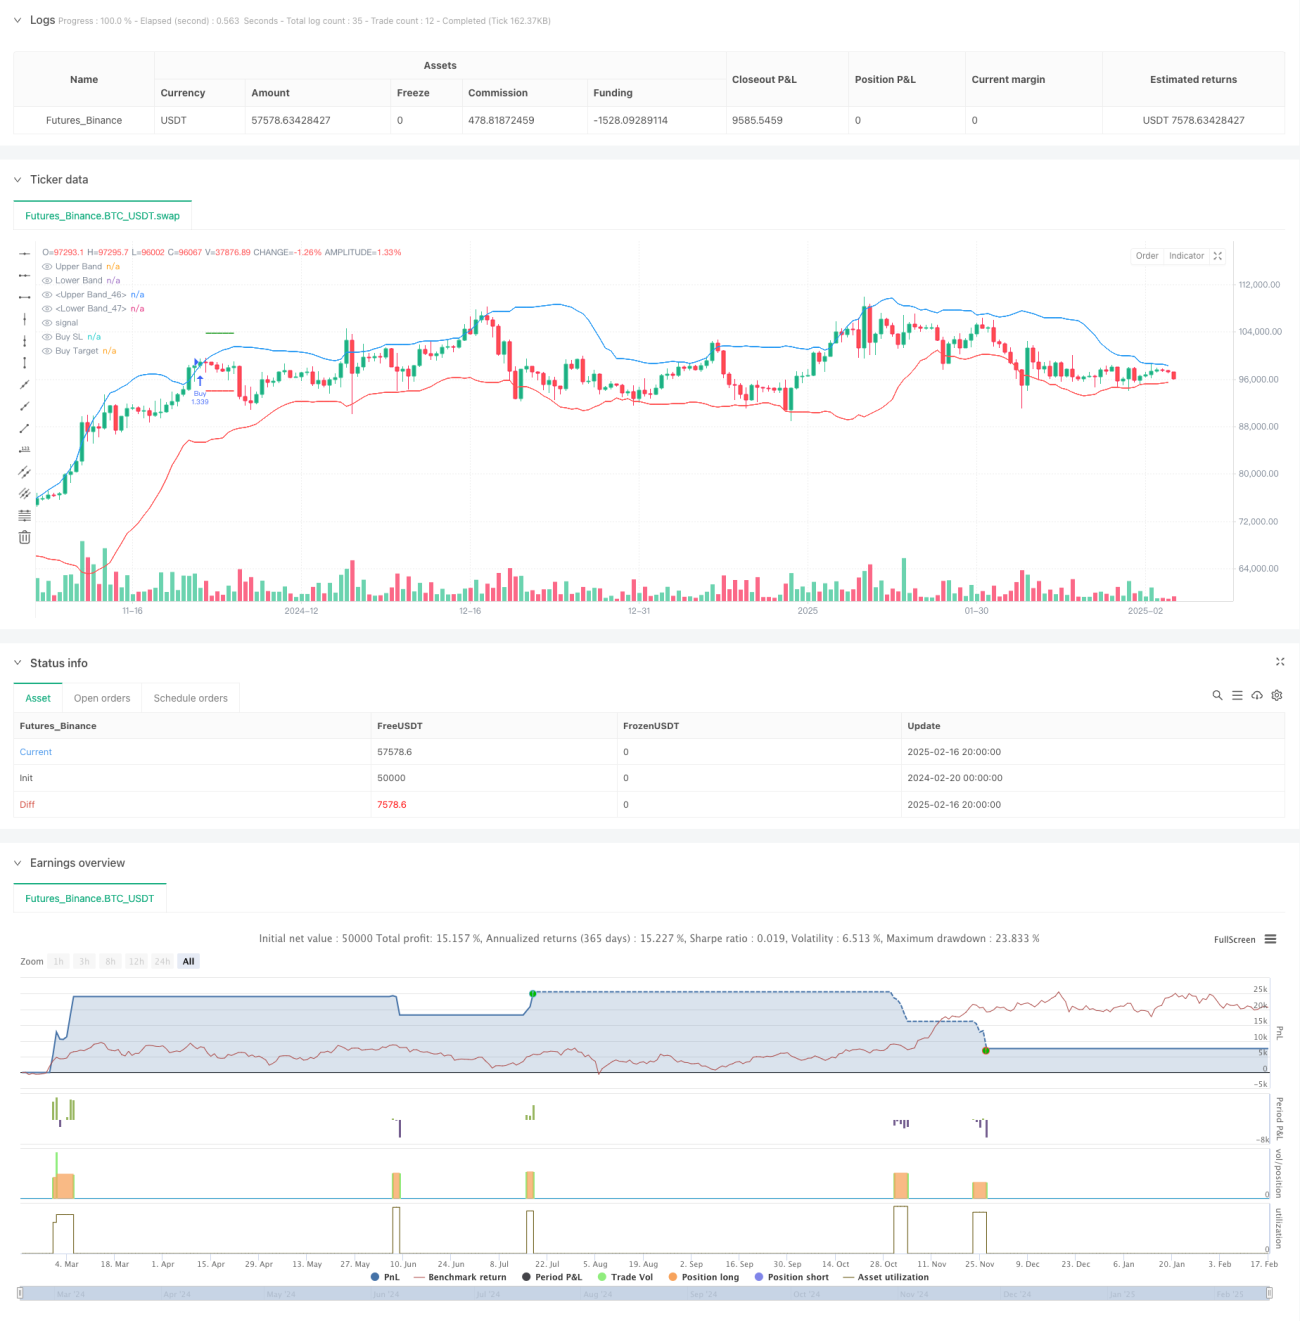
/*backtest
start: 2024-02-20 00:00:00
end: 2025-02-17 08:00:00
period: 12h
basePeriod: 12h
exchanges: [{"eid":"Futures_Binance","currency":"BTC_USDT"}]
*/

//@version=6
strategy("Bollinger Band Strategy (Close Near High/Low Relative to Half Range)", overlay=true, default_qty_type=strategy.percent_of_equity, default_qty_value=200, pyramiding=0)

// Bollinger Bands- 1