
Overview
This strategy is a short-term trading system that combines multiple technical indicators, primarily based on the Parabolic SAR (PSAR) as the core signal generator, while incorporating moving averages and momentum indicators for trade filtering, along with a combination of dynamic stop-loss and fixed take-profit risk management methods. The strategy is designed to consider market trends and volatility, making it suitable for short-term trading in volatile market conditions.
Strategy Principles
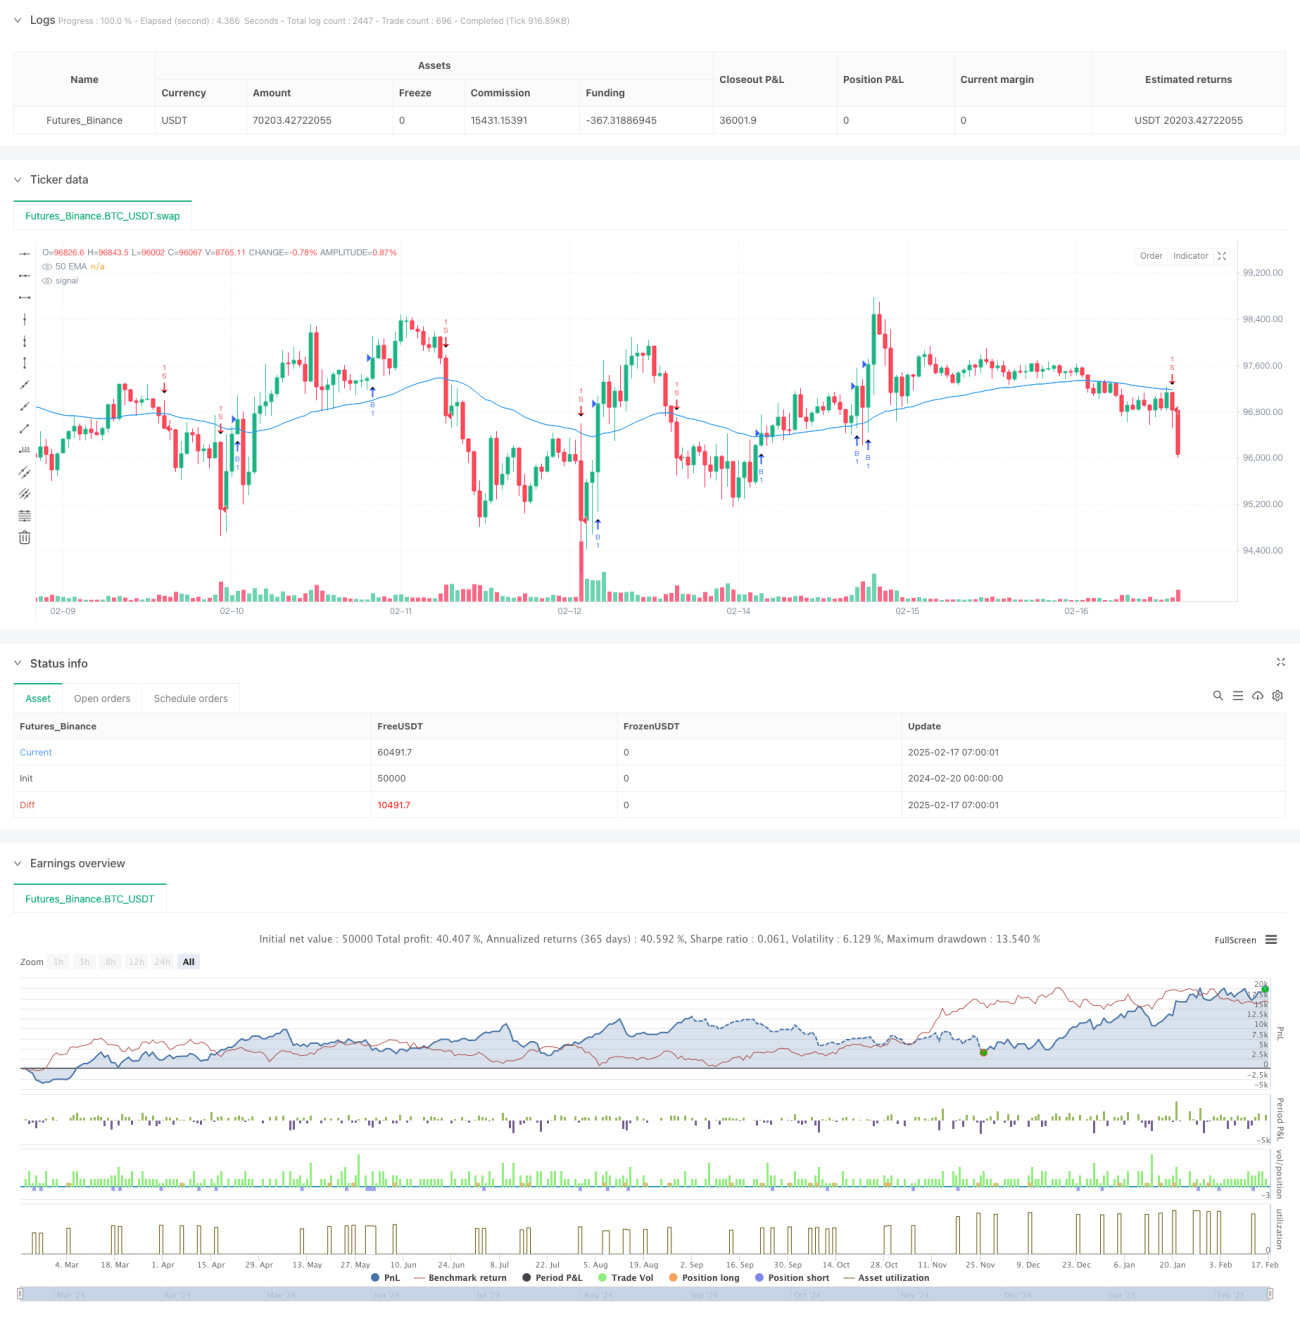
The strategy uses the PSAR indicator as its primary trend determination tool, generating trading signals when price crosses the PSAR. To enhance signal reliability, the following filters are added:
- 50-period Exponential Moving Average (EMA50) as a trend filter to ensure trade direction aligns with medium-term trends
- Relative Strength Index (RSI) to filter out ranging markets, requiring RSI>40 for long positions and RSI<60 for short positions
- Average True Range (ATR) for dynamic stop-loss calculation, providing more flexible risk control
- Fixed 0.7% take-profit target to secure gains promptly
- Position check mechanism to avoid duplicate entries
Strategy Advantages
- Comprehensive signal system: Combines trend following and momentum indicators for more reliable trading signals
- Flexible risk control: Dynamic stop-loss adapts to market volatility
- False breakout prevention: Multiple filtering conditions effectively reduce the impact of false signals
- Clear profit targets: Fixed take-profit ratio helps control holding time and improve capital efficiency
- Clear trading logic: Well-defined component responsibilities facilitate subsequent optimization and adjustment
Strategy Risks
- Over-filtering risk: Multiple conditions may cause missed trading opportunities
- Fixed take-profit limitations: 0.7% fixed take-profit may exit strong trends too early
- Parameter sensitivity: PSAR, EMA, RSI parameter settings significantly impact strategy performance
- Market environment dependence: May underperform in low volatility or highly volatile markets
- Slippage impact: Frequent trading may lead to higher transaction costs
Strategy Optimization Directions
- Dynamic take-profit mechanism: Adjust profit targets based on market volatility
- Position management optimization: Introduce volatility-based dynamic position sizing system
- Market environment recognition: Add market state identification module to adjust strategy parameters accordingly
- Indicator parameter optimization: Implement adaptive parameter adjustment mechanism
- Transaction cost control: Optimize entry/exit frequency to reduce trading costs
Summary
The strategy builds a complete trading system by combining multiple technical indicators, with solid considerations in trend identification, risk control, and trade execution. Its core strengths lie in its flexible risk control mechanism and comprehensive signal system, while attention needs to be paid to parameter optimization and market adaptability. Through continuous optimization and improvement, the strategy has the potential to maintain stable performance across different market conditions.
- 1