Multi-Indicator Trend Following Enhanced Quantitative Trading Strategy

Overview
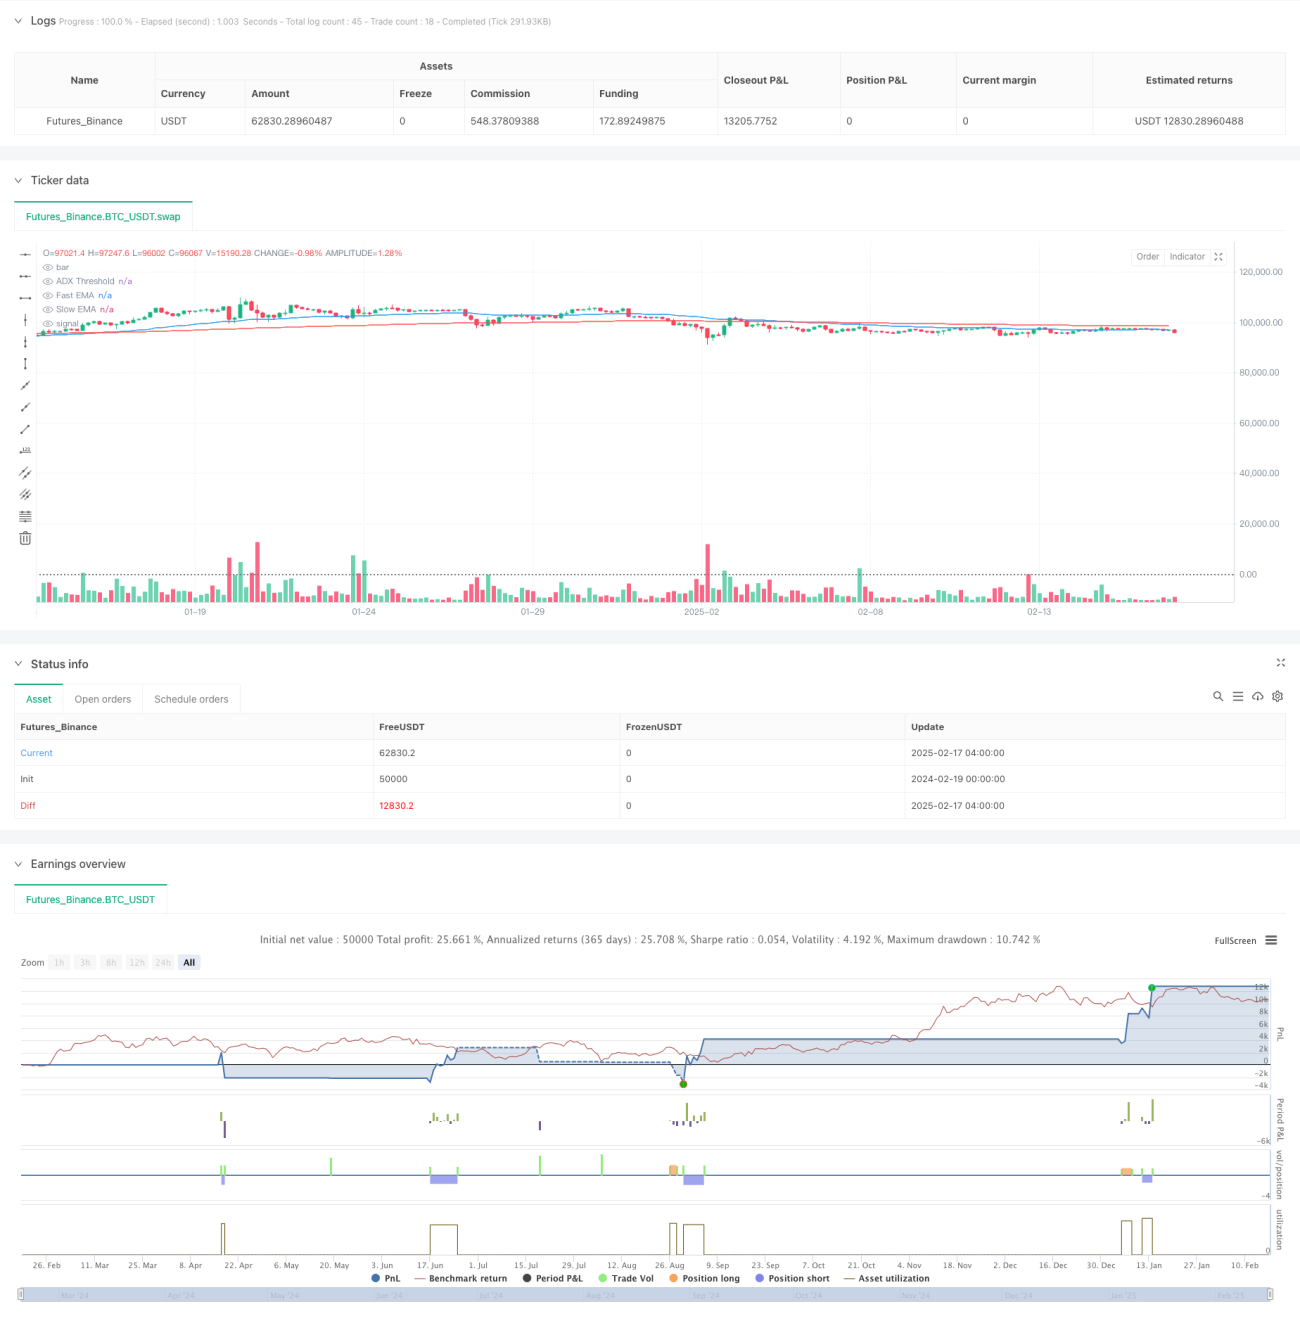
This strategy is a trend-following system that integrates multiple technical indicators including Exponential Moving Average (EMA), Average Directional Index (ADX), and Relative Strength Index (RSI), combined with multi-timeframe analysis. The strategy primarily uses fast and slow EMA crossovers to confirm trend direction, ADX for trend strength filtering, and RSI for momentum analysis, operating on a 1-minute chart for high-frequency trading. Backtesting results show a win rate of 76.92% and a profit factor of 1.819, demonstrating strong profitability.
Strategy Principles
The strategy operates based on the following core mechanisms:
- Uses 50-period and 200-period EMAs to identify trend direction, confirming entry signals through fast and slow line crossovers
- Employs ADX indicator (14-period) to evaluate trend strength, entering only when ADX is above 25 to avoid choppy markets
- Incorporates RSI indicator (14-period) for momentum analysis, considering long positions when RSI is below 30 and short positions above 70
- Introduces 4-hour timeframe EMA analysis to enhance trend confirmation through multi-timeframe analysis
- Implements dynamic take-profit and stop-loss levels, with take-profit at 5% and stop-loss at 2% for long positions, reversed for shorts
Strategy Advantages
- Multiple indicator cross-validation significantly improves signal reliability
- Comprehensive risk management including dynamic stop-loss and volatility-based position sizing
- Multi-timeframe analysis effectively reduces false breakout risks
- High win rate and moderate risk-reward ratio providing good expected returns
- Clear strategy logic that is easy to understand and maintain
Strategy Risks
- Rapid market movements may render stop-losses ineffective
- Ranging markets may generate frequent trades, increasing transaction costs
- EMA indicators have inherent lag, potentially missing optimal entry points
- Multiple indicators may generate conflicting signals
- 1-minute timeframe trading requires high execution speed, facing potential slippage risks
Strategy Optimization Directions
- Optimize ADX smoothing parameters to improve trend identification accuracy
- Implement ATR-based dynamic position sizing for better volatility adaptation
- Add volume analysis dimension to enhance signal reliability
- Consider market environment classification for different parameter sets under various market conditions
- Explore machine learning integration for parameter optimization
Summary
This strategy constructs a robust trend-following system through the synergy of multiple technical indicators. While maintaining a high win rate, it achieves considerable returns through comprehensive risk management mechanisms. Although there is room for optimization, the overall performance is satisfactory, particularly suitable for traders seeking steady returns.
/*backtest
start: 2024-02-19 00:00:00
end: 2025-02-17 08:00:00
period: 4h
basePeriod: 4h
exchanges: [{"eid":"Futures_Binance","currency":"BTC_USDT"}]
*/

//@version=5
strategy("Enhanced Trend Following Strategy", overlay=true, default_qty_type=strategy.percent_of_equity, default_qty_value=200)

// === INPUTS ===- 1