Dynamic RSI Breakout Trend Following Trading Strategy with Risk-Reward Ratio Optimization System

Overview
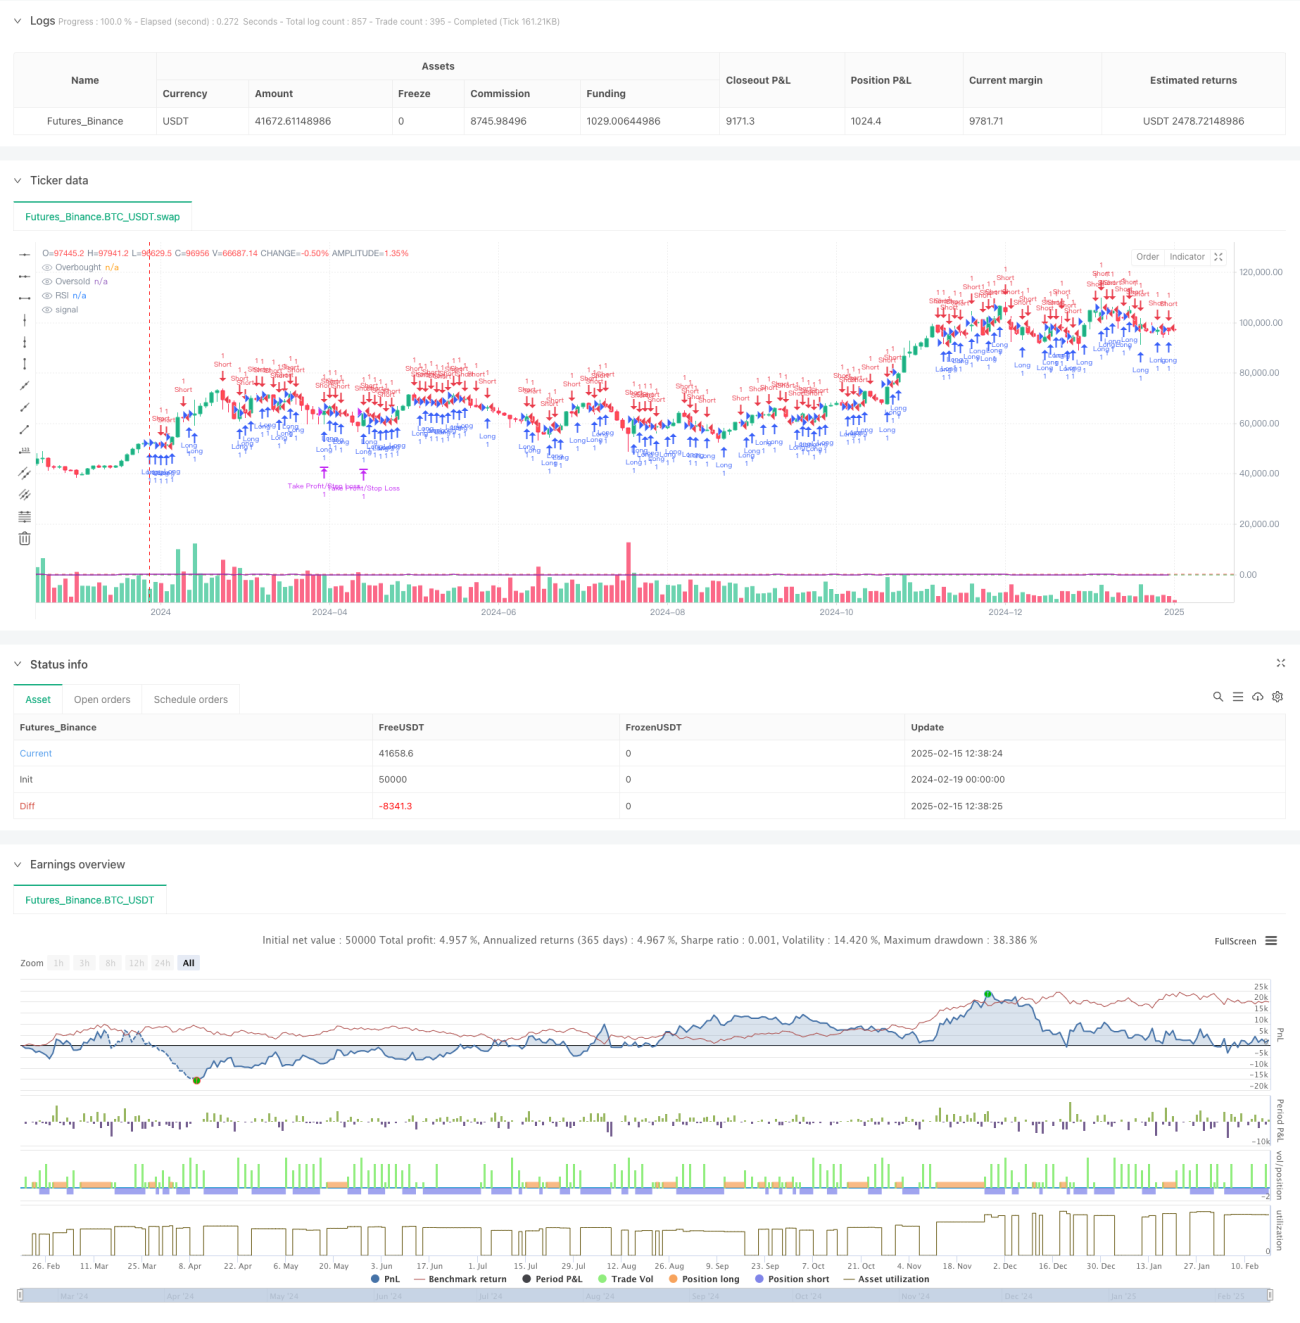
This strategy is a trend-following trading system based on RSI (Relative Strength Index) breakouts, combined with a 1:4 risk-reward ratio to optimize trading performance. The strategy identifies trend lines formed by RSI highs and lows, enters positions on breakouts, and uses a fixed risk-reward ratio for stop-loss and take-profit levels, implementing systematic trade management.
Strategy Principle
The core logic of the strategy is based on several key elements:
- RSI Trendline Breakout Signals: The system tracks local RSI highs and lows to form dynamic trend lines. Long positions are opened when RSI breaks above the high trendline, and short positions when it breaks below the low trendline.
- Entry Timing Identification: Uses RSI values comparison across three candles to confirm local highs and lows, improving trendline accuracy.
- Risk Management Mechanism: Uses the previous candle's low as stop-loss for long positions and high for short positions, ensuring clear risk control.
- Profit Optimization Design: Implements a 1:4 risk-reward ratio for take-profit levels, pursuing larger profit potential while controlling risk.
Strategy Advantages
- Systematic Decision-Making: Avoids subjective bias through programmatic RSI trendline identification and breakout detection.
- Strict Risk Control: Uses recent price volatility for stop-loss placement, controlling maximum risk per trade.
- Profit Ratio Optimization: Fixed 1:4 risk-reward ratio setup improves strategy's expected return.
- Trend Following Characteristics: Effectively captures medium to long-term trends, increasing profit opportunities.
- High Adaptability: Applicable to different markets and timeframes.
Strategy Risks
- False Breakout Risk: RSI breakouts may result in false signals leading to stop-loss exits.
- Distant Take-Profit Levels: 1:4 risk-reward ratio may set take-profit targets that are difficult to reach.
- Ranging Market Performance: May trigger frequent false signals in sideways markets.
- Slippage Impact: Actual stop-loss prices may differ from expected in less liquid markets.
Strategy Optimization Directions
- Dynamic Risk-Reward Ratio: Adjust risk-reward ratio based on market volatility.
- Trend Confirmation: Add trend confirmation indicators like moving averages or ATR.
- Position Management: Introduce volatility-based position sizing system.
- Exit Optimization: Implement trailing stops or scaled take-profit mechanisms.
- Time Filtering: Add trading session filters to avoid low liquidity periods.
Summary
The strategy builds a complete trend-following trading system by combining RSI breakouts with fixed risk-reward ratios. Its strengths lie in systematic decision-making processes and strict risk control, but practical application requires attention to false breakouts and market conditions. Through the suggested optimization directions, the strategy has the potential to achieve more stable performance across different market environments.
- 1