Multi-Indicator Dynamic Trend Crossover Quantitative Trading Strategy

Overview
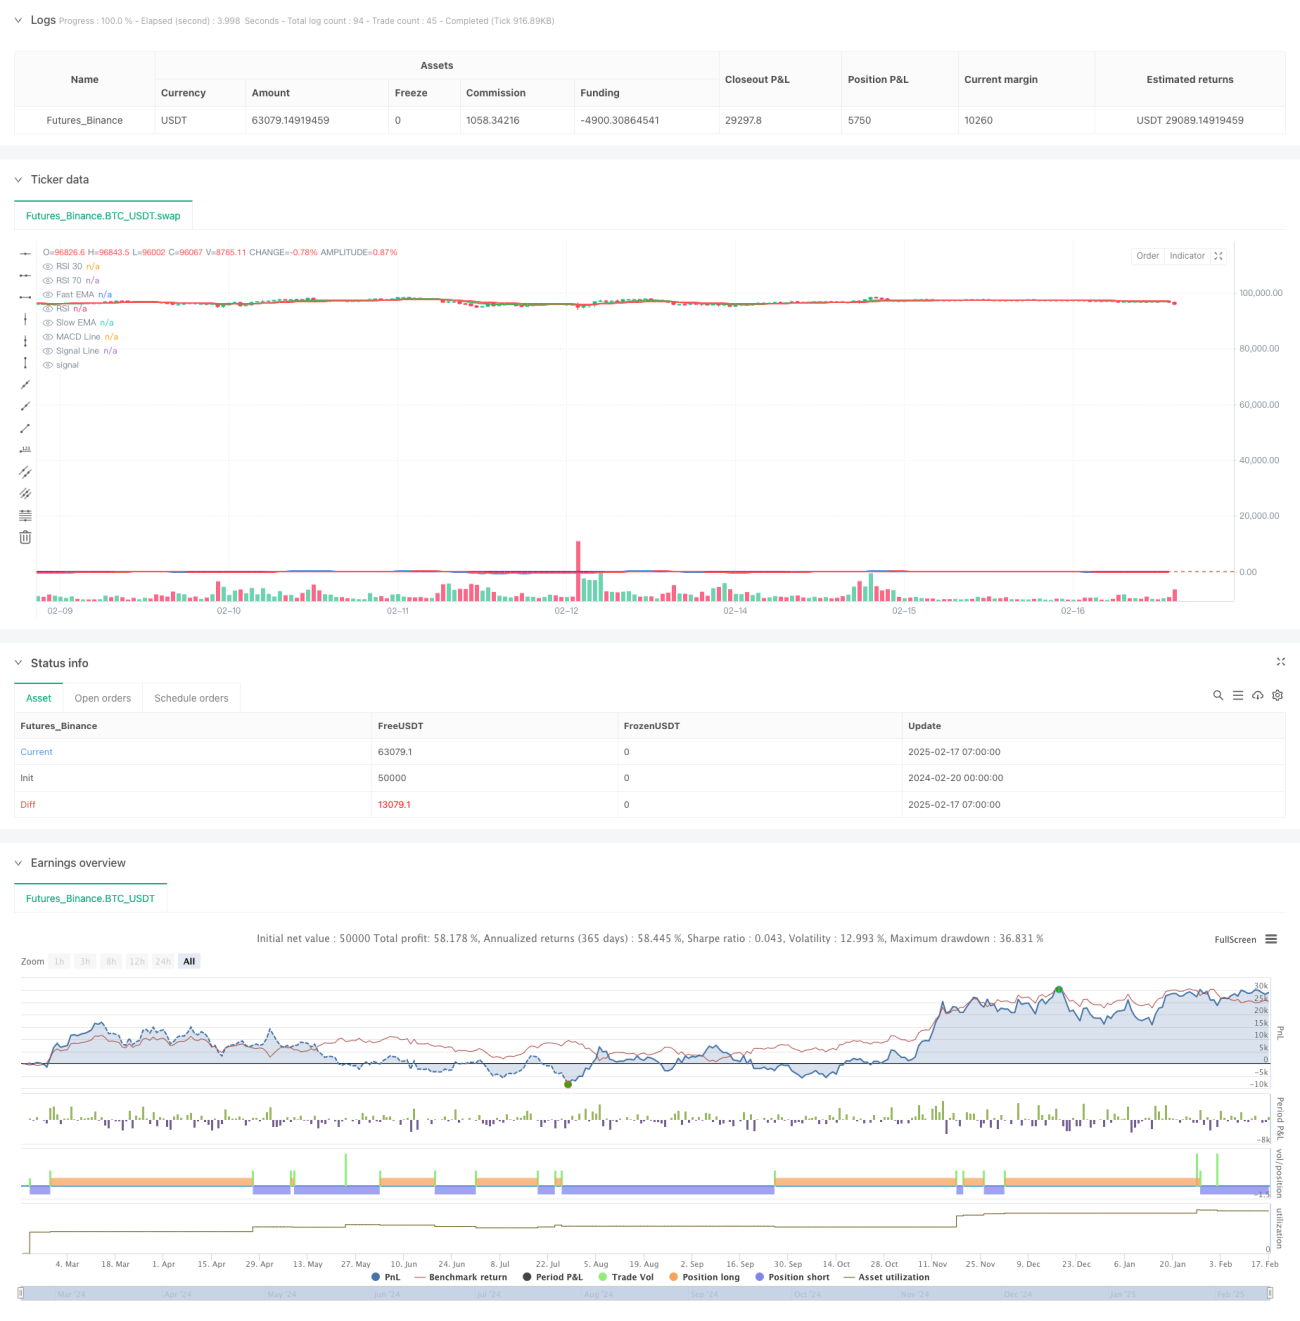
This strategy is a trend-following trading system based on multiple technical indicators, combining three classic technical indicators: Exponential Moving Average (EMA), Moving Average Convergence Divergence (MACD), and Relative Strength Index (RSI). It captures market trend changes and momentum through parameter settings including fast EMA (9 periods) and slow EMA (21 periods), MACD (12,26,9), and RSI (14), generating trading signals at indicator crossovers and threshold breakthroughs.
Strategy Principle
The core logic of the strategy is to identify market trend turning points through the confirmation of multiple technical indicators. It includes three aspects of signal confirmation:
- EMA Crossover Signal: A long signal is generated when the fast EMA crosses above the slow EMA, and a short signal when it crosses below.
- MACD Crossover Signal: Long position confirmed when MACD line crosses above the signal line, short position when crossing below.
- RSI Filter: Trades are allowed when RSI value is between 30-70, avoiding trades in excessive overbought/oversold areas.
The strategy executes trades only when all three indicators show synchronized signals.
Strategy Advantages
- Multiple indicator cross-validation effectively reduces the impact of false signals.
- Combination of trend following and momentum indicators enables more accurate capture of market turning points.
- RSI filtering mechanism avoids trading in excessive overbought/oversold areas.
- Clear strategy logic facilitates parameter adjustment and optimization.
- Capable of both long and short trading, adapting to different market environments.
Strategy Risks
- Multiple indicator confirmation may lead to signal lag, missing optimal entry points.
- Frequent crossover signals may occur in range-bound markets, increasing trading costs.
- Fixed RSI thresholds may lack flexibility in different market environments.
- Absence of stop-loss and take-profit mechanisms may result in significant losses during high volatility.
- Technical indicator parameters require thorough historical data validation.
Strategy Optimization Directions
- Introduce adaptive indicator parameters that adjust dynamically based on market volatility.
- Add stop-loss and take-profit mechanisms to control single trade risk.
- Include volume indicator verification to improve signal reliability.
- Develop market environment recognition module to use different trading parameters in different market states.
- Introduce money management module to adjust position size dynamically based on account risk.
- Consider adding trend strength filtering to avoid trading in weak trends.
Summary
This strategy captures market trend changes through multiple technical indicator cross-validation, offering good reliability and adaptability. However, in practical application, attention should be paid to signal lag and over-trading issues. It is recommended to optimize through introducing adaptive parameters, stop-loss mechanisms, and market environment recognition to improve strategy stability and profitability. During implementation, it is advised to conduct thorough historical data backtesting and parameter optimization, continuously adjusting and improving based on actual trading results.
- 1