Quantitative Momentum-Based Micropullback Breakout Strategy

ATR SMA OCA VOLUME
Created on: 2025-02-19 16:32:46 Modified on: 2025-02-19 17:25:25
Copy: 0 Number of hits: 335
avatar of ianzeng123 ianzeng123
2
Follow
319
Followers

 Quantitative Momentum-Based Micropullback Breakout Strategy  Quantitative Momentum-Based Micropullback Breakout Strategy

Overview

This strategy is a trading system based on price momentum and volume, focusing on identifying micropullback opportunities after strong upward movements. The strategy monitors short-term pullbacks following large green candles and enters trades when price reversal signals appear. The system employs multiple filtering conditions, including volume, ATR volatility, and pullback magnitude restrictions, to enhance trading accuracy.

Strategy Principles

The core logic is based on market momentum continuation, incorporating the following key elements: 1. Identifies strong upward candles through volume and ATR multiples, requiring volume above 1.5x average and exceeding 200,000 2. Monitors pullback process after upward movement, limiting maximum consecutive red candles to 3 3. Sets maximum pullback magnitude at 50%, abandoning trade opportunities if exceeded 4. 
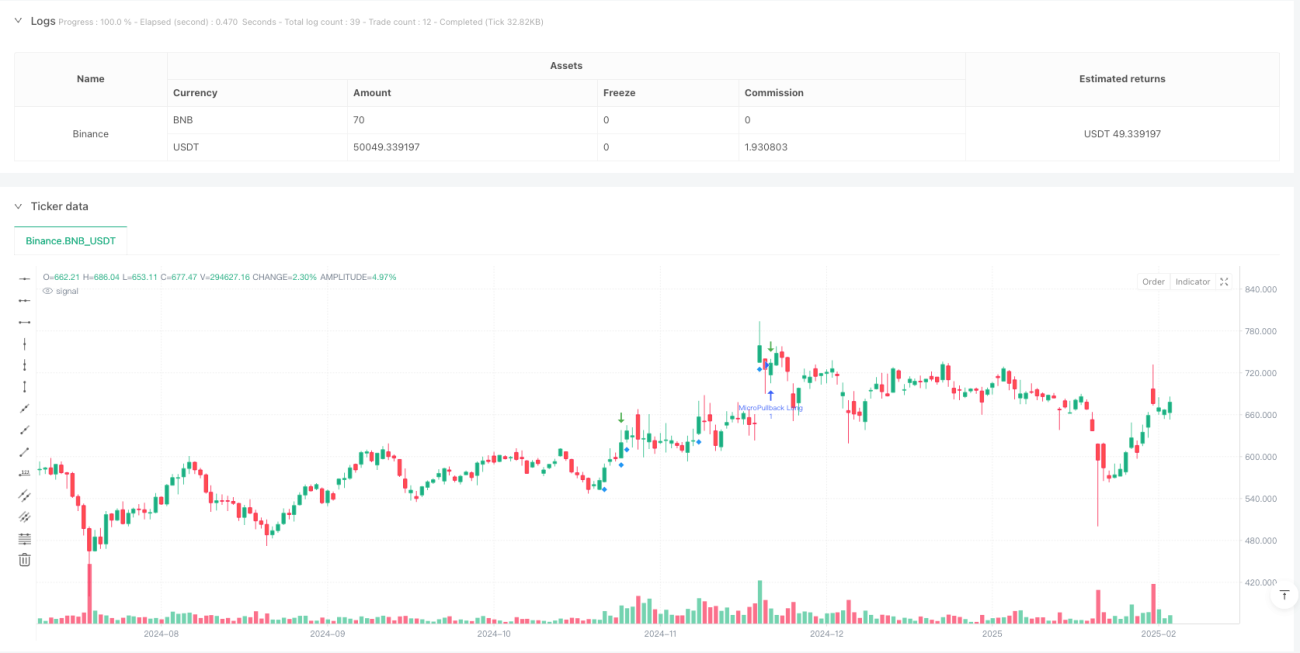
Triggers long signals when price breaks above previous high after pullback stabilization 5. Employs OCO order combination for position management, including stop-loss and profit targets 6. Sets stop-loss below pullback low, with profit target at 2x risk

Strategy Advantages

  1. Combines price momentum and volume confirmation, improving signal reliability
  2. Filters false breakouts through strict pullback conditions
  3. Uses objective technical indicators, reducing subjective judgment impact
  4. Clear risk control mechanism with fixed risk-reward ratio
  5. High degree of system automation, suitable for batch trading multiple instruments
  6. Good scalability, easy to add new filtering conditions

Strategy Risks

  1. May trigger frequent false signals during market volatility
  2. High-momentum stocks’ pullbacks might exceed preset limits
  3. Volume conditions require dynamic adjustment in different market environments
  4. Stop-loss placement might be too tight, susceptible to market noise
  5. Profit targets may be too aggressive, difficult to fully achieve
  6. Requires large sample size to verify strategy stability

Strategy Optimization Directions

  1. Introduce trend filters, such as moving average systems or trend indicators, to ensure trading with main trend
  2. Dynamically adjust volume thresholds to adapt to different market cycles
  3. Optimize stop-loss placement, consider using ATR multiples
  4. Add time filters to avoid market opening and closing volatility
  5. Incorporate multi-timeframe confirmation to improve signal reliability
  6. Develop adaptive parameter system to adjust strategy parameters based on market conditions

Summary

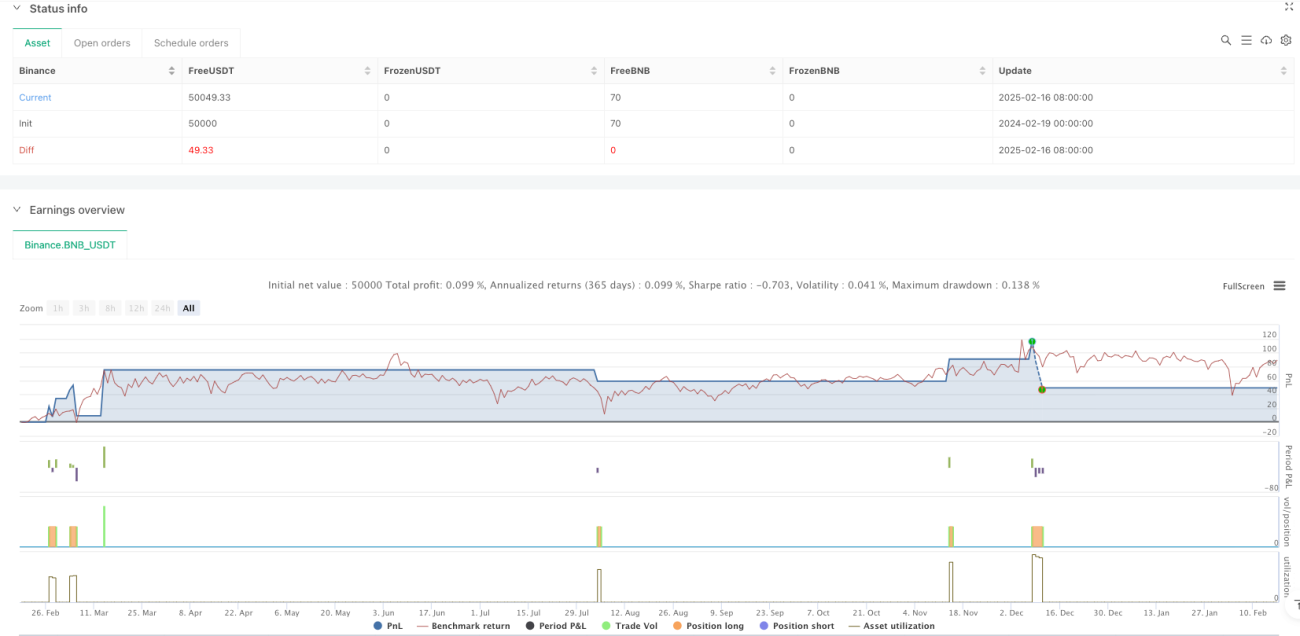
This is a well-designed trend-following strategy that captures quality trading opportunities through strict condition screening and risk management. The key to strategy success lies in parameter optimization and adaptability to market conditions. It is recommended to conduct thorough backtesting before live trading and adjust parameters according to specific trading instrument characteristics.

Strategy source code
/*backtest
start: 2024-02-19 00:00:00
end: 2025-02-17 08:00:00
period: 1d
basePeriod: 1d
exchanges: [{"eid":"Binance","currency":"BNB_USDT"}]
*/

//@version=6
strategy(title="Micropullback Detector w/ Stop Buy & Exits", shorttitle="MicroPB Det+Exits", overlay=true)

// USER INPUTS
volLookback = input.int(20, "Volume SMA Period", minval=1)
volMultiplier = input.float(1.5, "Volume Multiplier for High Volume", minval=1.0)
largeCandleATR = input.float(0.5, "Fraction of ATR to define 'Large Candle'", minval=0.1)
maxRedPullback = input.int(3, "Max Consecutive Red Candles in Pullback")
maxRetracementPc = input.float(50, "Max Retracement % for pullback", minval=1.0, maxval=100.0)

// CALCULATIONS
fastAtr = ta.atr(14)
avgVolume = ta.sma(volume, volLookback)
isLargeGreenCandle = (close > open) and ((close - open) > fastAtr * largeCandleATR) and (volume > avgVolume * volMultiplier) and (volume > 200000)

// HELPER FLAGS
isGreen = close >= open
isRed   = close < open

// STATE VARIABLES
var int   state = 0
var float waveStartPrice   = na
var float waveHighestPrice = na
var float largestGreenVol  = na
var int   consecutiveRedPulls = 0
var bool  triggerSignal    = false
var float wavePullbackLow  = na

if barstate.isnew
    triggerSignal:=false
    if state==0
        wavePullbackLow:=na
        if isLargeGreenCandle
            state:=1
            waveStartPrice:=open
            waveHighestPrice:=high
            largestGreenVol:=volume
            consecutiveRedPulls:=0
    else if state==1
        if isGreen
            waveHighestPrice:=math.max(waveHighestPrice,high)
            if volume>largestGreenVol
                largestGreenVol:=volume
        else
            state:=2
            consecutiveRedPulls:=1
            wavePullbackLow:=low
    else if state==2
        if isRed
            if volume>largestGreenVol
                state:=0
            consecutiveRedPulls+=1
            if consecutiveRedPulls>=maxRedPullback+1
                state:=0
            retracementLevel=waveStartPrice+(maxRetracementPc/100.0)*(waveHighestPrice-waveStartPrice)
            wavePullbackLow:=math.min(wavePullbackLow,low)
            if close<retracementLevel
                state:=0
        else
            consecutiveRedPulls:=0
            if high>high[1]
                triggerSignal:=true
                state:=3
    else if state==3
        state:=0

// Plot shapes for signals (last 1440 bars ~ 1 day at 1-min TF)
plotshape(isLargeGreenCandle, title="Large Green Candle", style=shape.diamond, location=location.belowbar, color=color.new(color.blue, 0), offset=0, size=size.small, show_last=1440)
plotshape(triggerSignal, title="MicroPB Entry", style=shape.arrowdown, location=location.abovebar, color=color.new(color.green, 0), offset=0, size=size.large, show_last=1440)

// ENTRY & EXITS
if triggerSignal
    // Stop Buy above the previous bar's high
    entryPrice = high[1]
    strategy.order("MicroPullback Long", strategy.long, limit=entryPrice, oca_name="MicroPullback")

    // Stoploss slightly below pullback low
    stopPrice = wavePullbackLow - 2*syminfo.mintick

    // Risk & take-profit calculations
    risk = entryPrice - stopPrice
    tpPrice = entryPrice + 2 * risk

    // Exit: stop or TP
    strategy.exit("SL+TP", "MicroPullback Long", stop=stopPrice, limit=tpPrice, qty_percent=100)

// ALERT
alertcondition(triggerSignal, title="MicroPullback LONG", message="Micropullback Long Signal Detected!")