
Overview
This strategy is a trend-following trading system based on Al Brooks' price action theory and the MACD indicator. It identifies market trends by combining Simple Moving Average (SMA) and MACD indicators, executing trades at appropriate times. The strategy employs a fixed risk-reward ratio to manage stop-loss and take-profit levels for each trade, ensuring effective risk control.
Strategy Principles
The core logic includes the following key elements:
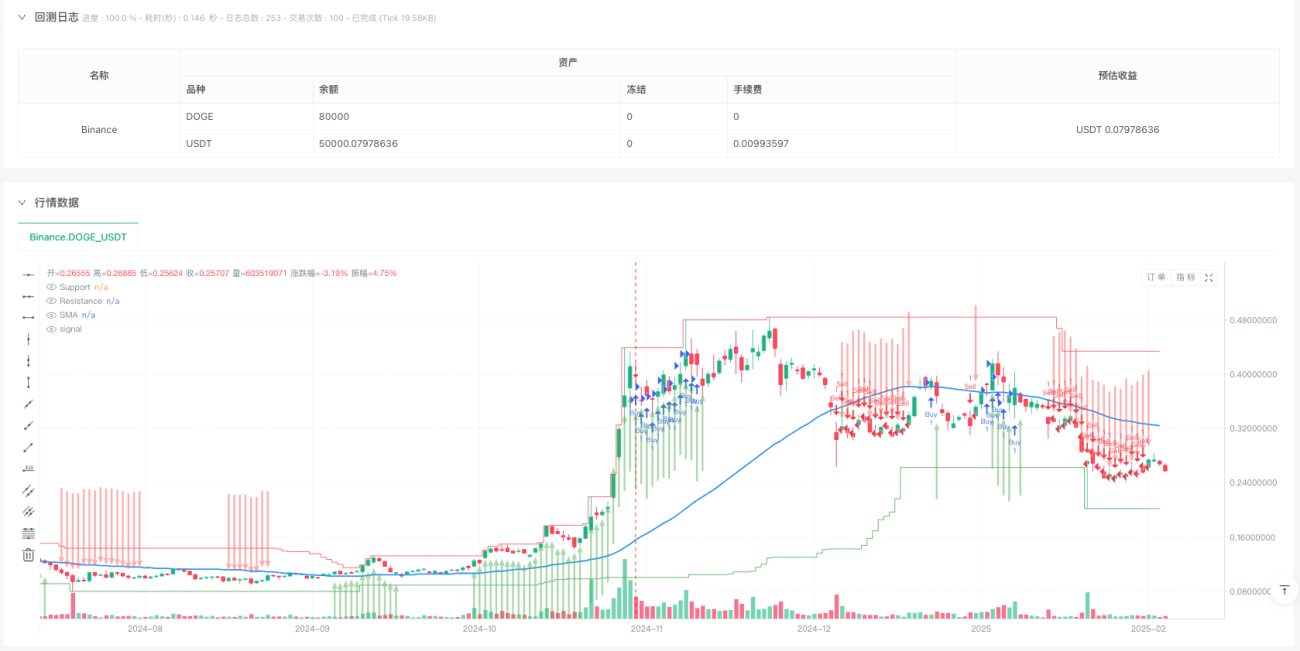
- Trend Identification: Uses Simple Moving Average (SMA) as a benchmark for trend determination, identifying uptrends when price is above SMA and downtrends when below.
- Entry Signals:
- Long Entry: Price above SMA, MACD line above 0 and crosses above signal line
- Short Entry: Price below SMA, MACD line below 0 and crosses below signal line
- Risk Management:
- Uses fixed percentage as stop-loss buffer
- Calculates take-profit levels based on preset risk-reward ratio
- Exit Mechanism: Automatically closes positions when buy or sell signals disappear
Strategy Advantages
- Trend Following Reliability: Combines price action and technical indicators for improved trend accuracy
- Scientific Risk Control: Implements fixed risk-reward ratio for trade management
- Comprehensive Signal Confirmation: Reduces false signals through multiple condition verification
- High Automation Level: Includes complete entry, exit, and risk management mechanisms
- Excellent Visualization: Provides clear support and resistance level display
Strategy Risks
- Trend Reversal Risk: May generate consecutive false signals at trend turning points
- Lag Risk: Both moving average and MACD have inherent lag
- Parameter Sensitivity: Strategy performance is sensitive to parameter settings
- Market Environment Dependency: May generate more losing trades in ranging markets
Strategy Optimization Directions
- Signal Filtering: Add volume or volatility indicators to filter signals
- Dynamic Parameters: Convert fixed risk-reward ratio to dynamic parameters based on market volatility
- Time Filtering: Add trading time window restrictions to avoid unfavorable trading periods
- Market Sentiment Integration: Incorporate market sentiment indicators to assist in trend strength assessment
Summary
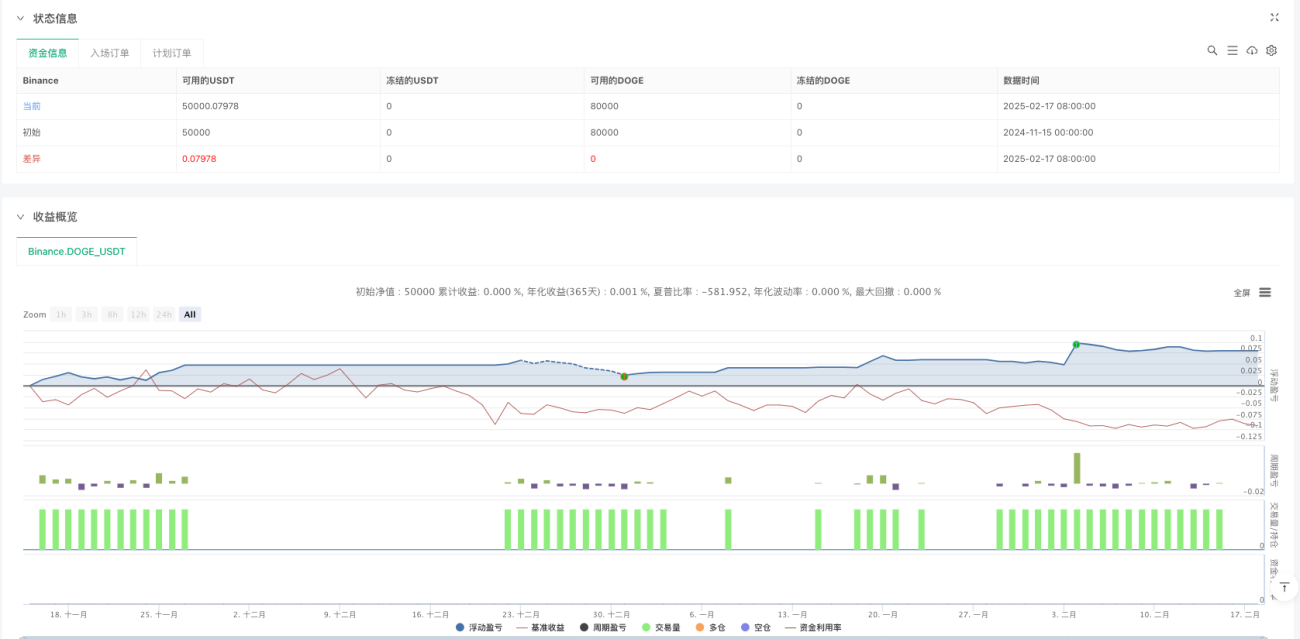
This is a complete trading system that combines classical price action theory with technical indicators. The strategy achieves relatively stable trading performance through strict signal confirmation mechanisms and risk management methods. While there are some inherent risks, the suggested optimization directions can further enhance the strategy's stability and profitability.
- 1