Dual Indicator Dynamic Trend Trading Strategy: Multi-dimensional Technical Analysis System Based on RSI and MACD
RSI MACD OB(Overbought) OS(Oversold) TA(Technical Analysis)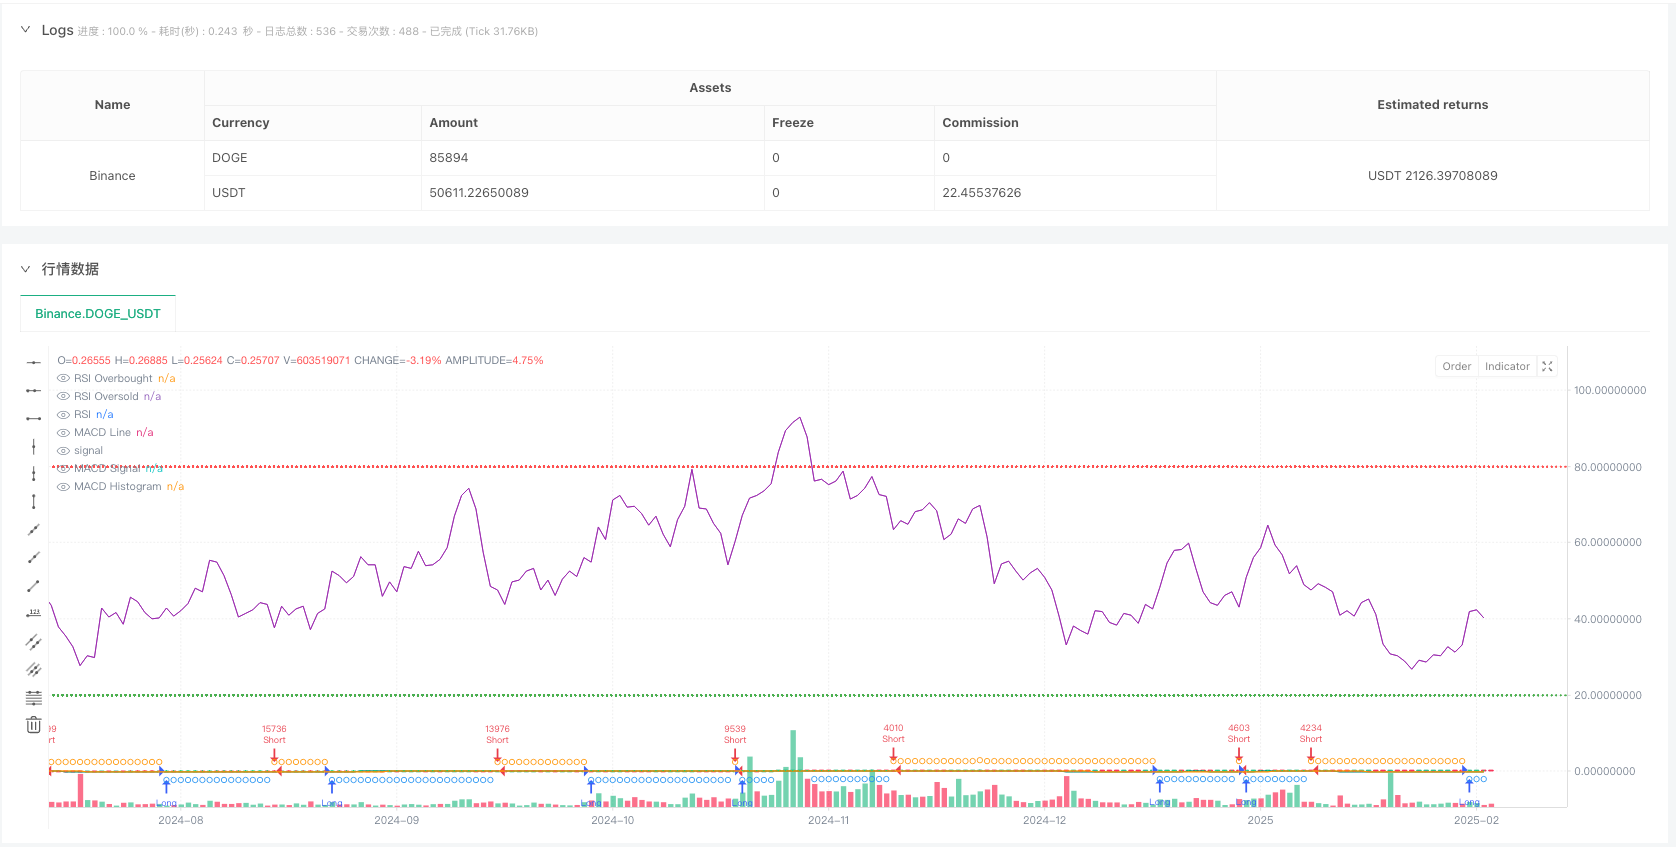
Overview
This is an automated trading strategy based on dual technical indicators: RSI and MACD. The strategy identifies potential trading opportunities by combining overbought/oversold signals with trend confirmation, enabling precise market timing. It employs percentage-based position management and includes built-in slippage protection, offering strong practicality and adaptability.
Strategy Principles
The core logic of the strategy is based on the following key elements: 1. Uses Relative Strength Index (RSI) for overbought/oversold determination, with parameters set to 14 periods, overbought at 80, and oversold at 20 2. Employs MACD(12,26,9) for trend confirmation, identifying trend changes through MACD and signal line crossovers 3. Trade signals require simultaneous satisfaction of RSI and MACD conditions: - Long conditions: RSI not overbought + MACD line above signal line - Short conditions: RSI not oversold + MACD line below signal line 4. Uses 3% of account equity as position size for each trade, with limitations on pyramiding same-direction trades
Strategy Advantages
- The combination of dual technical indicators significantly reduces false signals and improves trading reliability
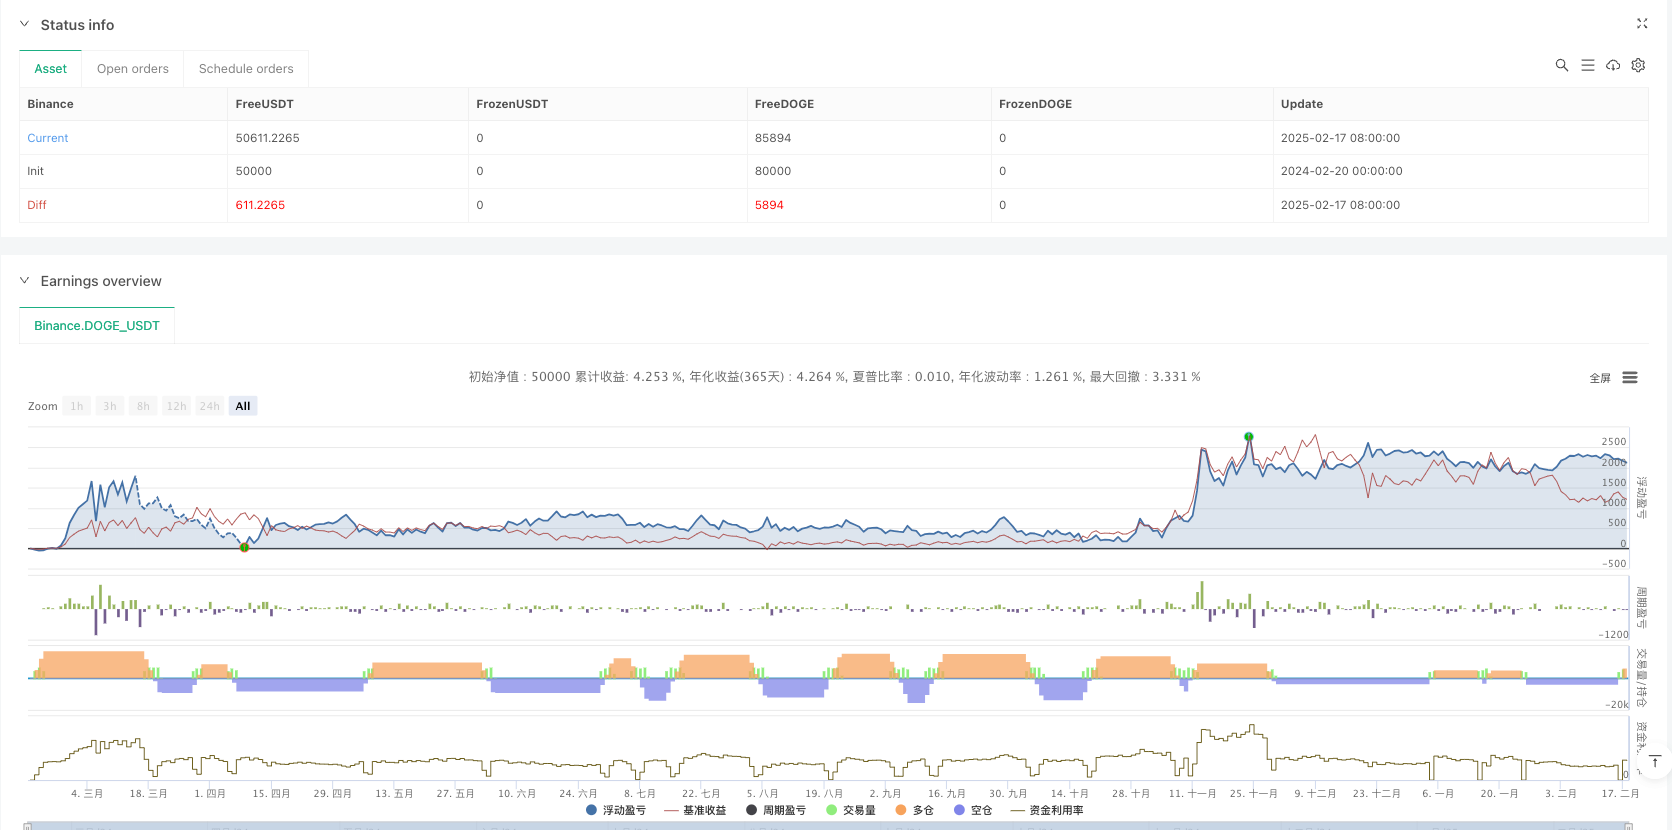
- Percentage-based position management facilitates dynamic capital adjustment and better risk control
- Built-in slippage protection (3 points) enhances strategy adaptability in live trading
- Strategy supports both long and short trading, maximizing market opportunities
- Customizable trading timeframes allow adjustment according to different market characteristics
Strategy Risks
- Both RSI and MACD are lagging indicators, potentially responding slowly in rapidly fluctuating markets
- Fixed overbought/oversold thresholds may need adjustment in different market environments
- The 3% fixed position size might be too large or small in certain situations
- Lack of stop-loss and take-profit conditions may lead to profit erosion or expanded losses
- Strict dual indicator conditions might miss some potential trading opportunities
Optimization Directions
- Implement adaptive RSI thresholds that dynamically adjust overbought/oversold criteria based on market volatility
- Add stop-loss and take-profit mechanisms, preferably using ATR or volatility-based dynamic stops
- Optimize position management system, considering dynamic position sizing based on market volatility and equity changes
- Add market environment filters to adjust strategy parameters or pause trading under different market conditions
- Consider incorporating volume indicators for signal confirmation to improve reliability
Summary
The strategy constructs a relatively robust trading system through the synergy of RSI and MACD. While there are some latency risks, the strategy maintains practical value through proper risk control and parameter optimization. It is recommended to conduct thorough backtesting before live implementation and optimize according to specific market characteristics.
//@version=6
strategy("Debugging Demo GPT",
         overlay=true,
         initial_capital=100,
         default_qty_type=strategy.percent_of_equity,
         default_qty_value=3,
         pyramiding=1,
         calc_on_order_fills=true,
         calc_on_every_tick=true,
         slippage=3)

// -----------------------------------------------------------------------
//   (1) Inputs: Start and End Date
// -----------------------------------------------------------------------


// -----------------------------------------------------------------------
//   (2) Indicators (RSI, MACD)
// -----------------------------------------------------------------------

// === RSI ===
rsiLen = input.int(14, "RSI Length")
rsiOB  = input.int(80, "RSI Overbought")
rsiOS  = input.int(20, "RSI Oversold")
rsiVal = ta.rsi(close, rsiLen)

// === MACD ===
fastLen  = input.int(12, "MACD Fast Length")
slowLen  = input.int(26, "MACD Slow Length")
sigLen   = input.int(9,  "MACD Signal Length")
[macdLine, sigLine, histLine] = ta.macd(close, fastLen, slowLen, sigLen)

// -----------------------------------------------------------------------
//   (3) Trading Logic: LONG/SHORT Filters
// -----------------------------------------------------------------------

bool rsiLongOk   = (rsiVal < rsiOB)
bool rsiShortOk  = (rsiVal > rsiOS)
bool macdLongOk  = (macdLine > sigLine)
bool macdShortOk = (macdLine < sigLine)

bool longCondition  = rsiLongOk and macdLongOk
bool shortCondition = rsiShortOk and macdShortOk

// -----------------------------------------------------------------------
//   (4) Entry Conditions
// -----------------------------------------------------------------------

// Debugging: Visualizing the conditions
plotshape(series=longCondition, location=location.belowbar, color=color.blue, style=shape.circle, title="LongCondition", size=size.tiny)
plotshape(series=shortCondition, location=location.abovebar, color=color.orange, style=shape.circle, title="ShortCondition", size=size.tiny)

// Entries only when all conditions are met
if longCondition
    strategy.entry("Long", strategy.long)
if shortCondition
    strategy.entry("Short", strategy.short)

// -----------------------------------------------------------------------
//   (5) Plotting for Visualization
// -----------------------------------------------------------------------

// RSI Plots
hline(rsiOB, "RSI Overbought", color=color.red, linestyle=hline.style_dotted)
hline(rsiOS, "RSI Oversold", color=color.green, linestyle=hline.style_dotted)
plot(rsiVal, title="RSI", color=color.purple)

// MACD Plots
plot(macdLine, color=color.teal, title="MACD Line")
plot(sigLine, color=color.orange, title="MACD Signal")
plot(histLine, style=plot.style_histogram, color=(histLine >= 0 ? color.lime : color.red), title="MACD Histogram")