Multi-Timeframe Dynamic Trend Following Strategy with EMA and ADX Integration

EMA ADX RSI
Created on: 2025-02-19 17:55:53 Modified on: 2025-02-27 17:52:45
Copy: 0 Number of hits: 435
avatar of ianzeng123 ianzeng123
2
Follow
319
Followers

 Multi-Timeframe Dynamic Trend Following Strategy with EMA and ADX Integration  Multi-Timeframe Dynamic Trend Following Strategy with EMA and ADX Integration

Overview

This strategy is a multi-timeframe trend following trading system that integrates multiple technical indicators including Exponential Moving Average (EMA), Average Directional Index (ADX), and Relative Strength Index (RSI) on a 15-minute timeframe. The strategy employs conservative position management, limiting risk to 2% of the account balance per trade to achieve long-term stable returns.

Strategy Principles

The strategy uses crossovers between fast EMA (50 periods) and slow EMA (200 periods) to identify trend direction, combined with ADX indicator to confirm trend strength. An ADX value above 25 indicates a strong trend market condition. RSI is used to identify overbought and oversold conditions, closing long positions at RSI 70 and short positions at RSI 30. Additionally, the strategy incorporates 4-hour timeframe EMA indicators as higher-level trend confirmation to improve trading accuracy.

Strategy Advantages

  1. Integration of multiple technical indicators reduces the impact of false signals and improves trading reliability.
  2. Dynamic take-profit and stop-loss settings allow flexible adjustment based on market volatility.
  3. Conservative position management (2% risk control) effectively reduces drawdown risk.
  4. Multi-timeframe analysis provides a more comprehensive market trend perspective.
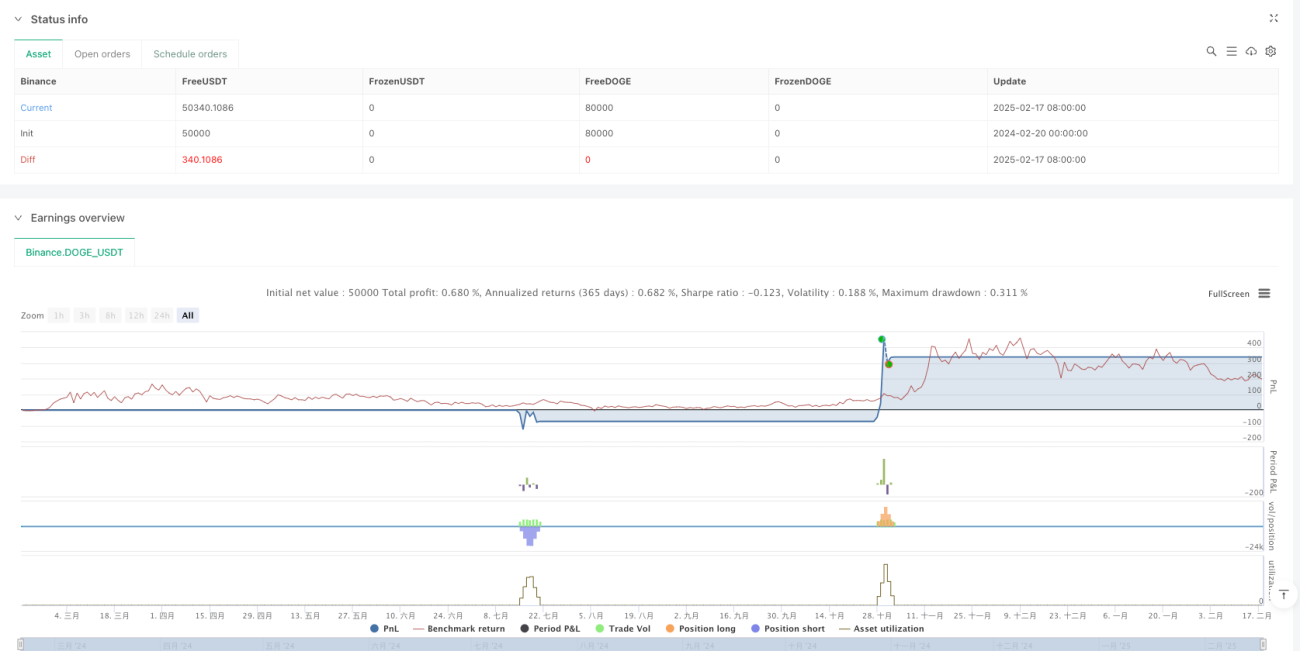
  5. Strategy backtesting shows a 62.86% win rate with a profit factor of 1.136.

Strategy Risks

  1. May generate frequent trading signals in ranging markets, increasing trading costs.
  2. EMA crossover strategy may lag in quick market reversals.
  3. Over-reliance on technical indicators might ignore fundamental factor impacts.
  4. Fixed ADX threshold may perform inconsistently across different market conditions.

Strategy Optimization Directions

  1. Introduce volatility indicators (like ATR) for dynamic adjustment of take-profit and stop-loss levels.
  2. Consider adding volume indicators as supplementary trade signal confirmation.
  3. Develop adaptive ADX threshold system to accommodate different market environments.
  4. Incorporate market sentiment indicators to improve entry timing accuracy.
  5. Optimize multi-timeframe period selection to find the optimal combination.

Summary

The strategy demonstrates promising trading potential through multi-dimensional technical analysis methods and strict risk control. While showing stable performance in backtesting, it still requires thorough validation in live trading environments. The modular design of the strategy provides strong adaptability and optimization potential, allowing flexible adjustments based on market changes.

Strategy source code
/*backtest
start: 2024-02-20 00:00:00
end: 2025-02-18 00:00:00
period: 1d
basePeriod: 1d
exchanges: [{"eid":"Binance","currency":"DOGE_USDT"}]
*/

//@version=5
strategy("DOGE Enhanced Trend Following Strategy", 
         overlay=true, 
         default_qty_type=strategy.percent_of_equity, 
         default_qty_value=5, 
         commission_value=0.1, 
         slippage=2)

// === INPUT PARAMETERS ===
emaFastLength = input(50, title="Fast EMA Length")
emaSlowLength = input(200, title="Slow EMA Length")
adxLength = input.int(14, title="ADX Length")
adxSmoothing = input.int(14, title="ADX Smoothing Factor")
adxThreshold = input.float(25, title="ADX Trend Strength Threshold")
rsiLength = input.int(14, title="RSI Length")
rsiOverbought = input.float(70, title="RSI Overbought Level")
rsiOversold = input.float(30, title="RSI Oversold Level")
takeProfitMultiplier = input.float(1.03, title="Take Profit Multiplier", tooltip="Set a dynamic take profit level, e.g., 1.03 = 3% profit")
stopLossMultiplier = input.float(0.97, title="Stop Loss Multiplier", tooltip="Set stop loss level, e.g., 0.97 = 3% below entry price")

// === INDICATOR CALCULATIONS ===
emaFast = ta.ema(close, emaFastLength)
emaSlow = ta.ema(close, emaSlowLength)
[dip, dim, adxValue] = ta.dmi(adxLength, adxSmoothing)
rsiValue = ta.rsi(close, rsiLength)

// === MULTI-TIMEFRAME CONFIRMATION ===
emaFastHTF = request.security(syminfo.tickerid, "240", ta.ema(close, emaFastLength))
emaSlowHTF = request.security(syminfo.tickerid, "240", ta.ema(close, emaSlowLength))

// === CONDITIONS FOR TRADE ENTRY ===
bullishTrend = ta.crossover(emaFast, emaSlow) and adxValue > adxThreshold and rsiValue > rsiOversold
bearishTrend = ta.crossunder(emaFast, emaSlow) and adxValue > adxThreshold and rsiValue < rsiOverbought

// === TRADE EXECUTION ===
if (bullishTrend)
    strategy.entry("Long", strategy.long)
    strategy.exit("TakeProfit_Long", from_entry="Long", limit=close * takeProfitMultiplier, stop=close * stopLossMultiplier)

if (bearishTrend)
    strategy.entry("Short", strategy.short)
    strategy.exit("TakeProfit_Short", from_entry="Short", limit=close * (2 - takeProfitMultiplier), stop=close * (2 - stopLossMultiplier))

// === VISUAL INDICATORS AND PLOTTING ===
plot(emaFast, color=color.blue, linewidth=2, title="Fast EMA")
plot(emaSlow, color=color.red, linewidth=2, title="Slow EMA")
hline(adxThreshold, "ADX Threshold", color=color.gray, linestyle=hline.style_dotted)

bgcolor(bullishTrend ? color.new(color.green, 85) : bearishTrend ? color.new(color.red, 85) : na)

// === ALERTS ===
alertcondition(bullishTrend, title="Buy Signal", message="Bullish trend detected. Consider entering a long position.")
alertcondition(bearishTrend, title="Sell Signal", message="Bearish trend detected. Consider entering a short position.")

// === STRATEGY SETTINGS FOR REALISTIC TESTING ===
strategy.close("Long", when=rsiValue > rsiOverbought, comment="Exit Long on RSI Overbought")
strategy.close("Short", when=rsiValue < rsiOversold, comment="Exit Short on RSI Oversold")