Multi-Indicator Crossover Dynamic Stop-Loss Trend Following Strategy

EMA RSI ADX MACD ATR
Created on: 2025-02-20 09:37:03 Modified on: 2025-02-27 17:52:08
Copy: 1 Number of hits: 382
avatar of ianzeng123 ianzeng123
2
Follow
319
Followers

 Multi-Indicator Crossover Dynamic Stop-Loss Trend Following Strategy  Multi-Indicator Crossover Dynamic Stop-Loss Trend Following Strategy

Overview

This strategy is a long-only approach for spot markets that utilizes multiple technical indicators. It primarily relies on the crossover signals between fast and slow Exponential Moving Averages (EMA), combined with the Relative Strength Index (RSI), Average Directional Index (ADX), and Moving Average Convergence Divergence (MACD) for trade confirmation. The strategy employs the Average True Range (ATR) for dynamic stop-loss and take-profit levels to manage risk.

Strategy Principles

The core logic is based on the following key components: 1. 
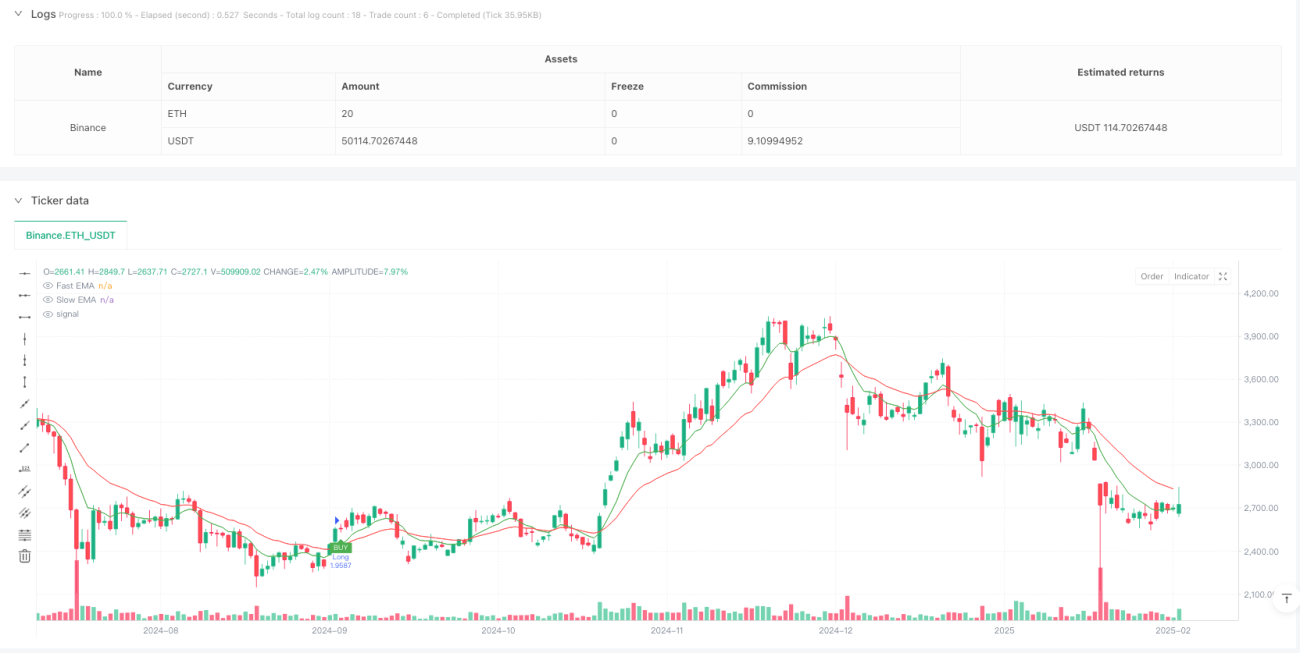
Uses 8-period and 21-period EMA crossover as primary entry signals 2. Confirms trend strength with ADX>25 3. Validates trend direction using MACD golden cross 4. Employs RSI<70 to avoid entries in overbought regions 5. Sets stop-loss at 1.5x ATR and take-profit at 2x ATR 6. Implements trailing stop-loss to secure profits

Strategy Advantages

  1. Multiple confirmation mechanisms significantly improve trade reliability
  2. Dynamic stop-loss and take-profit levels adapt to market volatility
  3. Trailing stop-loss effectively protects accumulated profits
  4. Executes trades only on confirmed candles, reducing false signals
  5. Uses percentage-based position sizing for better risk control
  6. Accounts for trading costs, reflecting real-world conditions

Strategy Risks

  1. Multiple indicators may cause missed trading opportunities
  2. Rapid oscillating markets might generate frequent false signals
  3. Large price gaps could render stop-losses ineffective
  4. Trading costs may impact overall strategy returns
  5. Long-only approach might underperform in bear markets

Strategy Optimization Directions

  1. Consider adding market environment filters to adjust parameters under different conditions
  2. Incorporate volume indicators as additional confirmation signals
  3. Optimize EMA and MACD parameters for different timeframes
  4. Refine profit-taking and stop-loss mechanisms, consider partial profit-taking
  5. Enhance position management logic for more flexible position control

Summary

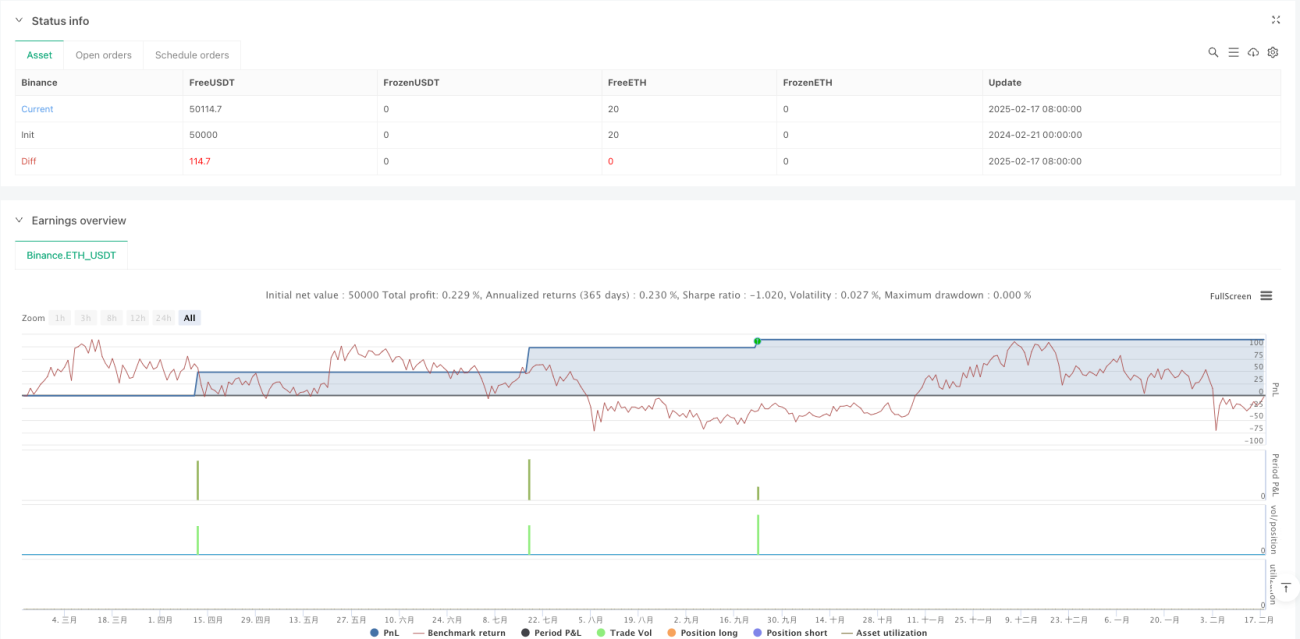
This is a well-designed trend-following strategy that seeks stable returns while controlling risk through the use of multiple technical indicators. The strategy’s strengths lie in its comprehensive confirmation mechanisms and risk management system, though it still requires parameter optimization and logic improvements based on actual market conditions. To address existing risks, the strategy can be enhanced by adding market environment filters and optimizing parameters to further improve stability and profitability.

Strategy source code
/*backtest
start: 2024-02-21 00:00:00
end: 2025-02-18 08:00:00
period: 1d
basePeriod: 1d
exchanges: [{"eid":"Binance","currency":"ETH_USDT"}]
*/

//@version=6
strategy("Optimized Long-Only Strategy (Spot Market) - Candle Signals Only", overlay=true, initial_capital=10000, default_qty_type=strategy.percent_of_equity, default_qty_value=10, commission_type=strategy.commission.percent, commission_value=0.1)

// INPUTS
fastEMA_len         = input.int(8, "Fast EMA Length", minval=1)
slowEMA_len         = input.int(21, "Slow EMA Length", minval=1)
rsiPeriod           = input.int(14, "RSI Period")
rsiOverbought       = input.int(70, "RSI Overbought Level", minval=50)
adxPeriod           = input.int(14, "ADX Period", minval=1)
adxThreshold        = input.int(25, "ADX Trend Strength Threshold", minval=1)
fastMACD            = input.int(12, "MACD Fast Length", minval=1)
slowMACD            = input.int(26, "MACD Slow Length", minval=1)
signalMACD          = input.int(9, "MACD Signal Length", minval=1)
atrPeriod           = input.int(14, "ATR Period", minval=1)
atrStopMultiplier   = input.float(1.5, "ATR Stop Loss Multiplier", step=0.1)
atrProfitMultiplier = input.float(2.0, "ATR Profit Target Multiplier", step=0.1)

// CALCULATIONS
emaFast   = ta.ema(close, fastEMA_len)
emaSlow   = ta.ema(close, slowEMA_len)
rsiValue  = ta.rsi(close, rsiPeriod)

// --- Custom ADX Calculation ---
up      = ta.change(high)
down    = -ta.change(low)
plusDM  = (up > down and up > 0) ? up : 0
minusDM = (down > up and down > 0) ? down : 0
trueRange = ta.tr(true)  // 'handle_na' parameter set to true
atrVal    = ta.rma(trueRange, adxPeriod)
plusDI    = 100 * ta.rma(plusDM, adxPeriod) / atrVal
minusDI   = 100 * ta.rma(minusDM, adxPeriod) / atrVal
dx        = 100 * math.abs(plusDI - minusDI) / (plusDI + minusDI)
adxValue  = ta.rma(dx, adxPeriod)

// MACD Calculation (MACD line, signal line, histogram)
[macdLine, signalLine, _] = ta.macd(close, fastMACD, slowMACD, signalMACD)

// ATR for stops and targets
atrValue  = ta.atr(atrPeriod)

// TRADING CONDITION (Long Only, on confirmed candle)
longCondition = ta.crossover(emaFast, emaSlow) and (adxValue > adxThreshold) and (macdLine > signalLine) and (rsiValue < rsiOverbought)

// POSITION MANAGEMENT: Execute only on confirmed candles
if barstate.isconfirmed and longCondition
    strategy.entry("Long", strategy.long)
    longStop   = close - atrStopMultiplier * atrValue
    longTarget = close + atrProfitMultiplier * atrValue
    strategy.exit("Long Exit", from_entry="Long", stop=longStop, limit=longTarget, trail_points=atrValue * 0.5, trail_offset=atrValue * 0.3)

// PLOTTING
plot(emaFast, color=color.green, title="Fast EMA")
plot(emaSlow, color=color.red, title="Slow EMA")
plotshape(barstate.isconfirmed and longCondition, title="Buy Signal", style=shape.labelup, location=location.belowbar, color=color.green, text="BUY", textcolor=color.white, size=size.tiny)