Overview
This strategy is a comprehensive trend-following trading system that combines multiple technical indicators. It primarily relies on the crossover signals between Simple Moving Average (SMA) and Exponential Moving Average (EMA), while integrating advanced features such as Hull Moving Average (HMA) ribbon, Williams %R indicator, swing high/low analysis, and dynamic filtering mechanisms to provide more reliable trading signals.
Strategy Principles
The core logic is built upon several key elements: 1. Utilizes 100-period SMA and 200-period EMA as primary trend indicators 2. Incorporates 70-period HMA ribbon for trend momentum confirmation 3. Employs Williams %R for dynamic support/resistance calculation 4. Detects swing highs and lows within a 20-period lookback window 5. Monitors and updates intraday high/low levels in real-time 6. Implements opening period filters and volatility threshold (0.5%) to reduce false signals
Entry conditions require: price above both moving averages, %R showing three consecutive periods of improvement above -20, bullish candle closing higher than previous, price within daily volatility threshold. Exit conditions trigger on either: price falling below both moving averages or %R dropping below -80.
Strategy Advantages
- Multiple technical indicator verification enhances signal reliability
- Dynamic filtering mechanism effectively reduces false signals during high volatility periods
- Adaptive support/resistance calculation provides good market adaptability
- Comprehensive intraday trading management including opening period filters and volatility thresholds
- Highly customizable parameters for optimization across different market conditions
Strategy Risks
- Moving average system may generate frequent false signals in ranging markets
- Multiple condition filtering might miss potential trading opportunities
- Fixed moving average periods may perform inconsistently across different market environments
- Intraday trading filters might miss crucial opportunities in rapid trend movements
- Parameter optimization risks overfitting issues
Strategy Optimization Directions
- Introduce adaptive moving average period calculations for better market volatility adaptation
- Add volume analysis indicators to improve trend confirmation reliability
- Develop dynamic stop-loss and take-profit mechanisms for improved capital management
- Incorporate market volatility indicators to optimize filter threshold settings
- Consider multi-timeframe signal coordination to enhance system stability
Summary
This is a well-designed trend-following trading system that maintains good flexibility while ensuring reliability through multiple technical indicators and strict filtering mechanisms. The main areas for optimization lie in parameter adaptability and risk management mechanism refinement. Traders are advised to thoroughly test performance under various market conditions and adjust parameters according to specific circumstances before live trading.
/*backtest
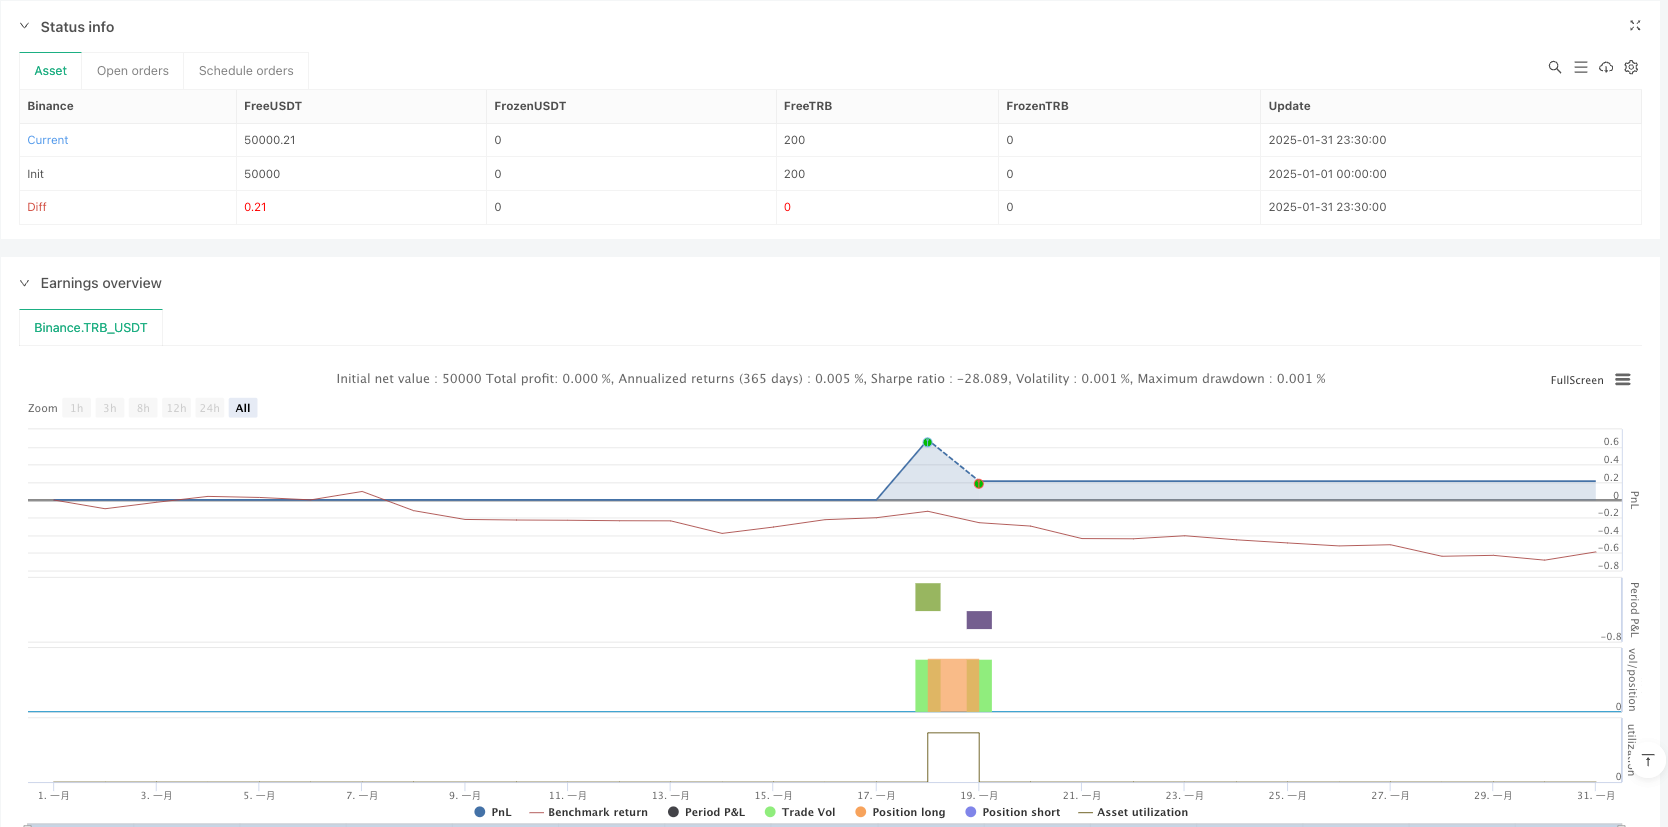
start: 2025-01-01 00:00:00
end: 2025-01-31 23:59:59
period: 30m
basePeriod: 30m
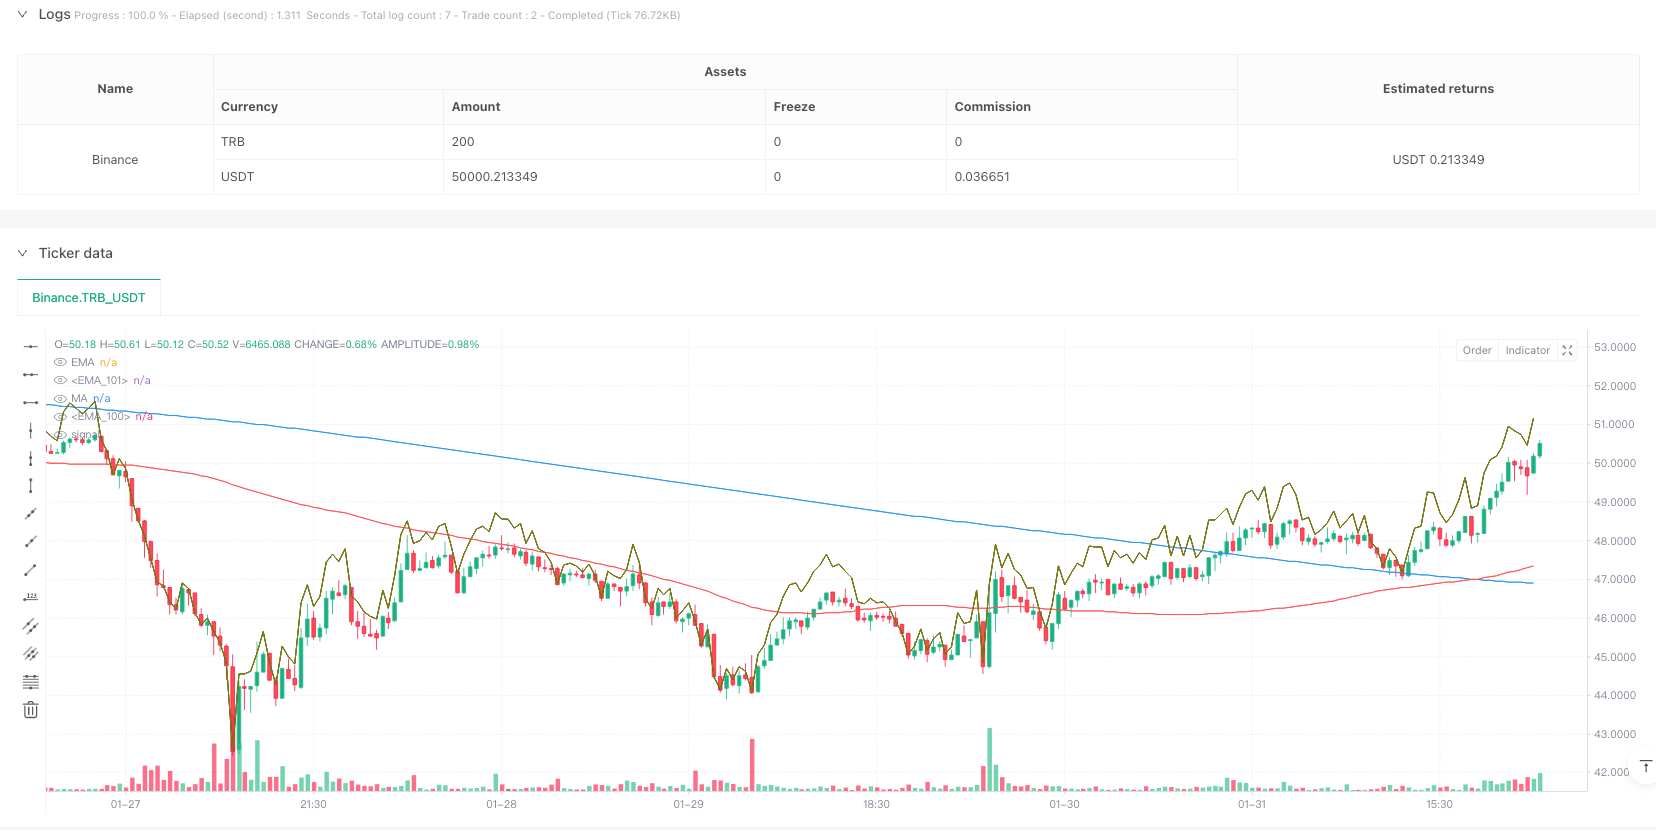
exchanges: [{"eid":"Binance","currency":"TRB_USDT"}]
*/
//@version=5
strategy(title="EMA & MA Crossover Strategy", shorttitle="EMA & MA Crossover Strategy", overlay=true)
// Inputs
LengthMA = input.int(100, minval=1, title="MA Length")
LengthEMA = input.int(200, minval=1, title="EMA Length")
swingLookback = input.int(20, title="Swing Lookback")
Lengthhmaribbon = input.int(70, minval=1, title="HMA Ribbon")
// Input for ignoring the first `n` candles of the day
ignore_n_candles = input.int(1, "Ignore First N Candles", minval=0)
// Input for percentage threshold to ignore high run-up candles
run_up_threshold = input.float(0.5, "Run-up Threshold (%)", minval=0.0)
//====================================================================
hmacondition = ta.hma(close,Lengthhmaribbon)> ta.hma(close,Lengthhmaribbon)[1]
//====================================================================
// Function to drop the first `n` candles
dropn(src, n) =>
na(src[n]) ? na : src
// Request data with the first `n` candles dropped
valid_candle = not na(dropn(close, ignore_n_candles))
// Check for run-up condition on the previous candle
prev_run_up = (high[1] - low[1]) / low[1] * 100
// Combine conditions: exclude invalid candles and ignore high run-up candles
valid_entry_condition = valid_candle and prev_run_up <= run_up_threshold
//======================================================
// Define the start of a new day based on time
var is_first = false
var float day_high = na
var float day_low = na
// Use time() to detect the start of a new day
t = time("1440") // 1440 = 60 * 24 (one full day in minutes)
is_first := na(t[1]) and not na(t) or t[1] < t
if is_first and barstate.isnew
day_high := high
day_low := low
else
day_high := nz(day_high[1], high)
day_low := nz(day_low[1], low)
// Update daily high and low
if high > day_high
day_high := high
if low < day_low
day_low := low
//====================================================
previousdayclose = request.security(syminfo.tickerid, "D", close)
day_highrange = previousdayclose*.018
//======================================================
length = input(title="Length", defval=14)
src = input(close, "Source")
_pr(length) =>
max = ta.highest(length)
min = ta.lowest(length)
100 * (src - max) / (max - min)
percentR = _pr(length)
//======================================================
higherline = close* 1+((100-(percentR*-1))/100)
lowerline = close* 1-((100-(percentR*-1))/100)
//======================================================
// Moving Averages
xMA = ta.sma(close, LengthMA)
xEMA = ta.sma(xMA, LengthEMA)
// Plot the MA and EMA lines
plot(xMA, color=color.red, title="MA")
plot(xEMA, color=color.blue, title="EMA")
// Find recent swing high and low
recentHigh = ta.highest(high, swingLookback)
recentLow = ta.lowest(low, swingLookback)
//===============================================
emacondition = ta.ema(close,20)>ta.ema(close,30) and ta.ema(close,30)>ta.ema(close,40) and ta.ema(close,40)>ta.ema(close,50) and close >ta.ema(close,20)
// Define Buy Condition
buyCondition1 = (percentR>percentR[1] and percentR[1]>percentR[2] and percentR[2]>percentR[3]) and percentR>-20 and percentR[1]>-20
buyCondition = (close> xMA and close> xEMA) and (close > open and close > close[1]) or xMA>xEMA and close<day_highrange and hmacondition and emacondition
// Define Sell Conditions
sellCondition = (close < xMA and close < xEMA) or xMA<xEMA or percentR<-80
// Strategy Execution
if (buyCondition and buyCondition1 and valid_entry_condition)
strategy.entry("Buy", strategy.long)
if (sellCondition)
strategy.close("Buy") // Close the long position
// Candle coloring for buy/sell indication
barcolor(buyCondition ? color.green : sellCondition ? color.red : na)
plot(higherline, color=color.olive, title="EMA")
plot(higherline, color=color.black, title="EMA")