Advanced Dual-Moving Average Momentum Reversal Strategy: RSI and Bollinger Bands Synergy Trading System

Overview
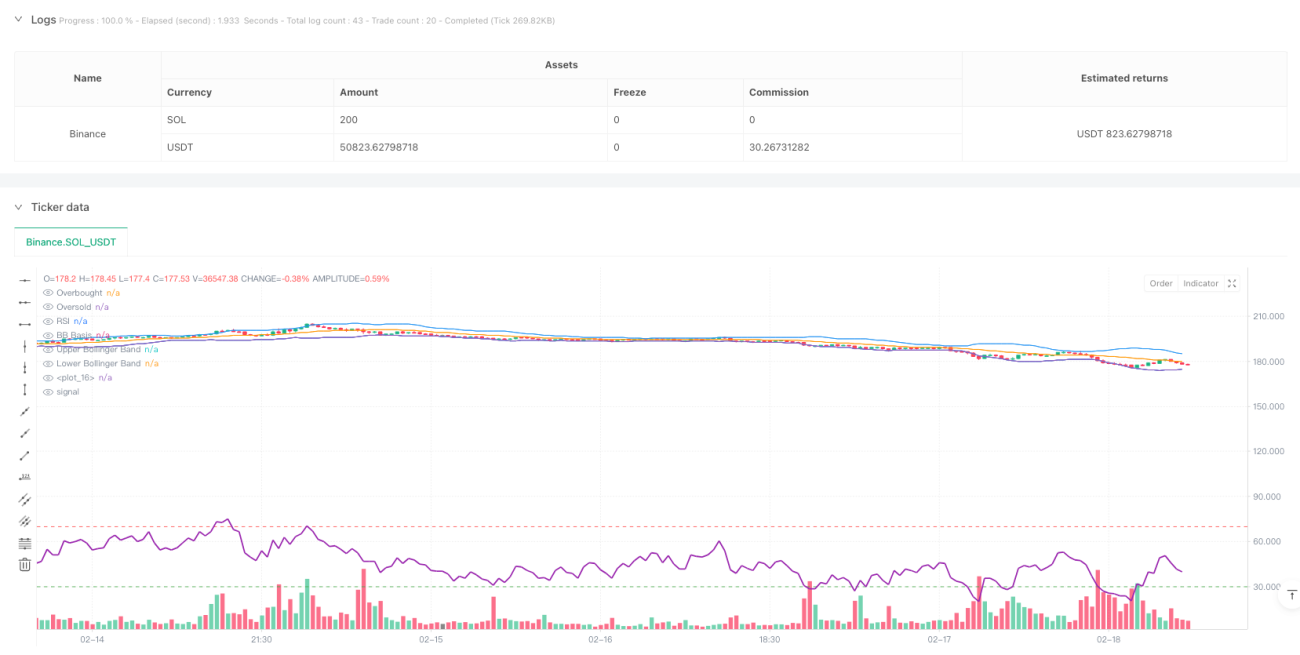
This strategy is an advanced technical analysis trading system that combines the Relative Strength Index (RSI) and Bollinger Bands (BB). It seeks high-probability reversal trading opportunities in overbought and oversold market areas by synergistically using these two indicators. The strategy employs a 20-period moving average as the Bollinger Bands basis line, with 2 standard deviations for the upper and lower bands, while using a 14-period RSI for momentum analysis, generating trading signals when RSI breaks through 30/70 key levels and price touches the Bollinger Bands boundaries.
Strategy Principles
The core logic is built on the synergistic effect of two main technical indicators:
- Bollinger Bands use a 20-period simple moving average as the middle band, with upper and lower bands at 2 standard deviations, identifying price volatility range.
- RSI uses a 14-period setting, with 30 as oversold and 70 as overbought levels, determining market momentum status.
- Long conditions require: RSI breaking above 30 and price touching or below the lower Bollinger Band.
- Short conditions require: RSI breaking below 70 and price touching or above the upper Bollinger Band.
- Exit conditions include: RSI breaking opposite extremes or price breaking the Bollinger Band middle line.
Strategy Advantages
- Dual confirmation mechanism: Combining RSI and Bollinger Bands provides more reliable trading signals.
- Strong adaptability: Bollinger Bands automatically adjust bandwidth based on market volatility.
- Comprehensive risk control: Clear entry and exit conditions prevent overtrading.
- Good visualization: Strategy provides clear visual indicators for market state understanding.
- Parameter adjustability: Key parameters can be optimized for different market characteristics.
Strategy Risks
- Choppy market risk: May generate frequent false breakout signals in sideways markets.
- Trend market risk: Reversal signals might lead to premature exits in strong trends.
- Parameter sensitivity: Different market environments may require different parameter settings.
- Slippage risk: Actual execution prices may deviate from signal prices in less liquid markets.
- Systematic risk: May face significant drawdowns during extreme market volatility.
Strategy Optimization Directions
- Add trend filters: Introduce additional trend indicators to avoid counter-trend trades.
- Optimize parameter adaptation: Develop dynamic parameter adjustment mechanisms.
- Enhance risk management: Add dynamic stop-loss and profit target settings.
- Incorporate volume analysis: Integrate volume indicators to improve signal reliability.
- Develop market environment recognition: Build market state classification system for parameter adjustment.
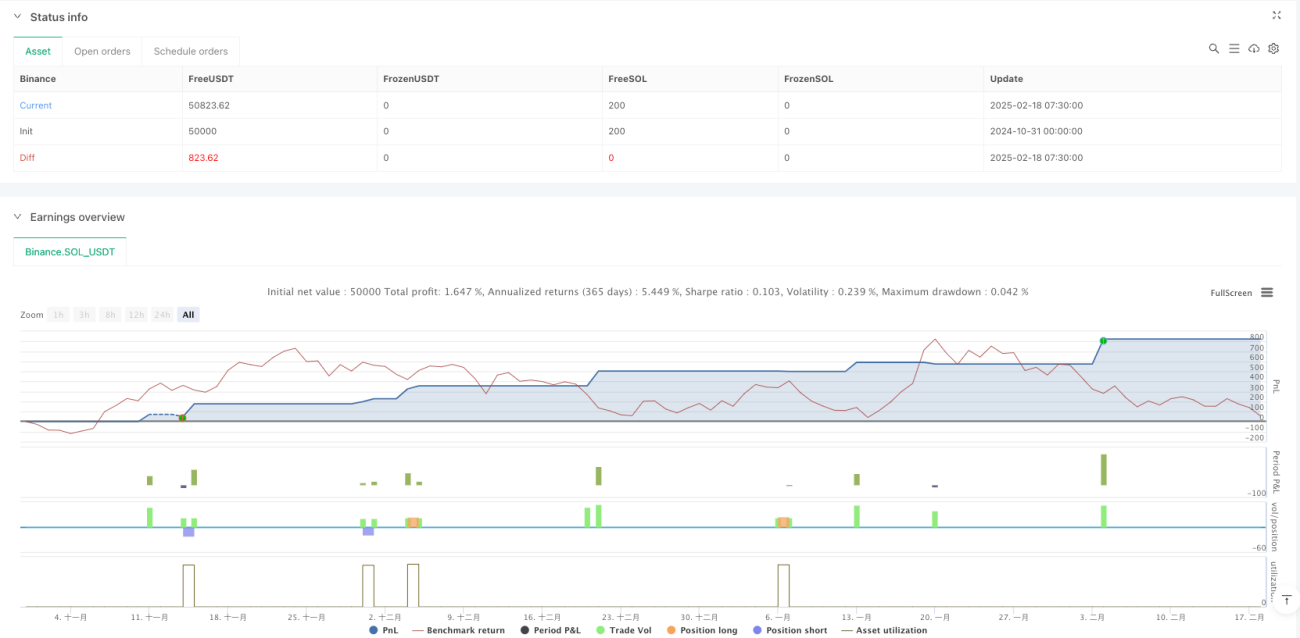
Summary
This strategy builds a complete trading system through the synergy of RSI and Bollinger Bands. It provides clear entry and exit signals while maintaining good risk control mechanisms. Though inherent risks exist, continuous optimization and improvement enable the strategy to maintain stable performance across different market environments. The modular design also provides a solid foundation for future optimization and expansion.
/*backtest
start: 2024-10-31 00:00:00
end: 2025-02-18 08:00:00
period: 30m
basePeriod: 30m
exchanges: [{"eid":"Binance","currency":"SOL_USDT"}]
*/

//@version=5
strategy("RSI + Bollinger Bands Strategy", overlay=true, default_qty_type=strategy.percent_of_equity, default_qty_value=10)

// Bollinger Bands Settings- 1