Multi-Indicator Intraday Quantitative Trading Strategy: Dynamic Signal System Based on VWAP-Fibonacci-RSI-SMA

Overview
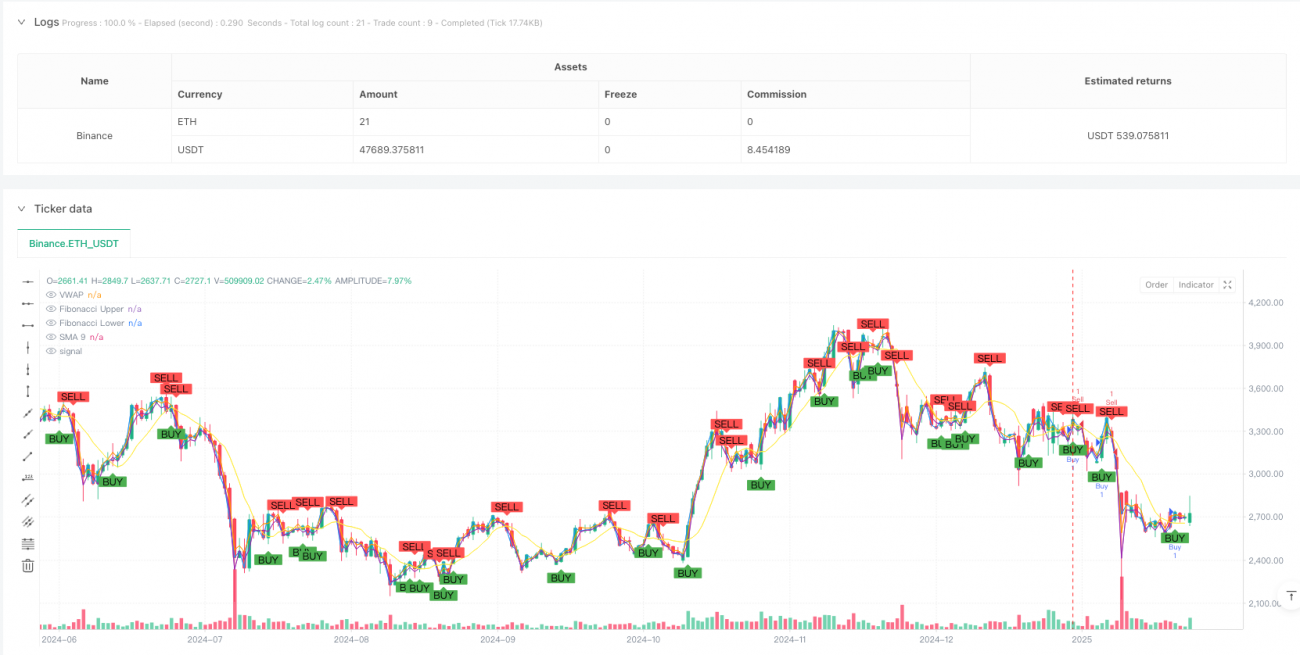
This is an intraday quantitative trading strategy that organically combines multiple technical indicators, integrating Volume Weighted Average Price (VWAP), Fibonacci retracement levels, Relative Strength Index (RSI), and Simple Moving Average (SMA) to construct a multi-dimensional trading signal system. The strategy seeks high-probability trading opportunities in market fluctuations through the synergistic combination of different indicators.
Strategy Principles
The strategy employs a multi-layer filtering mechanism to confirm trading signals:
- Uses RSI to identify overbought and oversold areas, generating buy signals when RSI crosses above 30 (oversold) and sell signals when crossing above 70 (overbought)
- Establishes price movement reference ranges through Fibonacci retracement levels (0.382 and 0.618), only allowing trades when price is within this range
- Uses VWAP as a trend confirmation indicator, supporting long positions above VWAP and short positions below
- Incorporates SMA as an auxiliary indicator, generating additional trading signals when price crosses the SMA
Final trading signals must satisfy either RSI or SMA conditions while complying with Fibonacci range and VWAP position requirements.
Strategy Advantages
- Multiple signal confirmation mechanism significantly improves trading reliability and reduces the impact of false signals
- Combines trend and oscillation trading approaches, capable of capturing both trending opportunities and range-bound trades
- Incorporation of VWAP considers volume factors, making the strategy more aligned with actual market conditions
- Application of Fibonacci retracement levels helps determine key price areas, improving entry timing accuracy
- Clear strategy logic with well-defined indicator roles, facilitating monitoring and adjustment
Strategy Risks
- Multiple conditions may cause missed trading opportunities, especially in fast-moving markets
- RSI and SMA may generate lagging signals in volatile markets
- Fibonacci retracement range calculations rely on historical data and may become invalid when market conditions change significantly
- VWAP's reference value may vary across different time periods
- Proper stop-loss settings are necessary for risk control to avoid excessive losses during violent fluctuations
Strategy Optimization Directions
- Introduce adaptive parameter optimization mechanisms to dynamically adjust indicator parameters based on market volatility conditions
- Enhance volume analysis dimension by adding volume anomaly detection to the VWAP foundation
- Consider adding market volatility indicators to adjust strategy aggressiveness in different volatility environments
- Improve stop-loss and take-profit mechanisms, potentially implementing dynamic stop-loss solutions
- Add trading time filters to identify market characteristics in different time periods
Summary
This is a comprehensive and logically rigorous intraday trading strategy. Through the synergistic effect of multiple technical indicators, it pursues stable returns while controlling risks. The strategy possesses strong practicality and scalability, capable of adapting to different market environments through proper parameter optimization and risk control. However, users need to deeply understand the characteristics of each indicator, set parameters reasonably, and maintain constant attention to risk control.
- 1